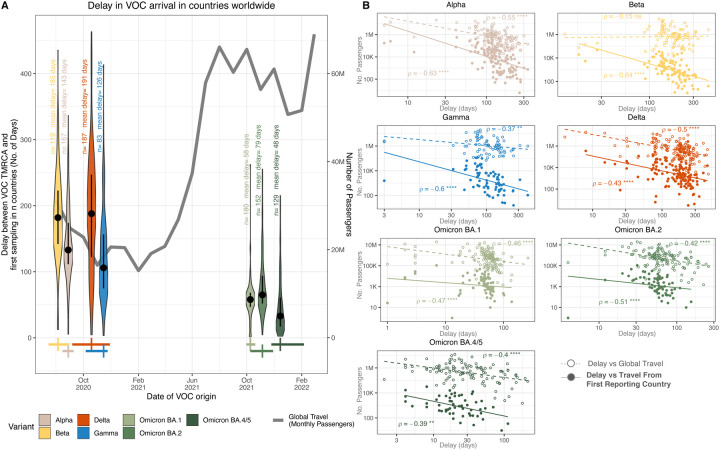
Figure 3: Impact of global air travel on VOC dissemination.
A) Delay (number of days since TMRCA) of each VOC to be first sampled in countries around the world, and the total global monthly air passenger volumes from September 2020 to March 2022. The number of points and mean of each violin plot are indicated. The dot and error bars inside each group denote the median and interquartile range, respectively. Dates of VOC origin are taken as their published mean estimated dates of emergence (TMRCA), with crosses representing the median and high confidence range values1–3,6,8,26. The date of arrival of each VOC per country is taken to be the first sampling date of a sequenced case in GISAID (Date of access = 18 September 2022). B) Scatter plot and spearman rank correlations of either travel volumes from the first reporting country or total global travel with the delay in first sampling of VOCs in countries globally. Spearman rank correlation values are shown, with level of significance indicated.

