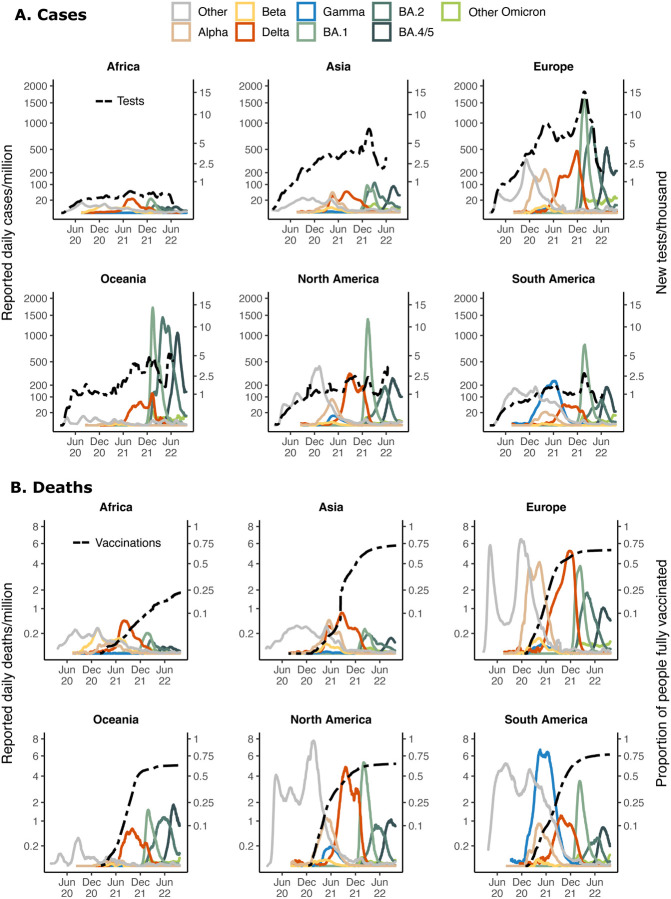
Figure 4: Continental epidemiology of SARS-CoV-2 cases, mortality, testing and vaccination.
A) The progression of daily reported cases per continent from February 2020 to October 2022 (log scale, first y-axis). The 7-day rolling average of daily reported case numbers is coloured by the inferred proportion of variants responsible for the infections, as calculated by genomic surveillance data (GISAID date of access: 1 October 2022) averaged over 20 days. The line shows the 7-day rolling average of the number of daily tests per thousand population per region (scale shown in the second y-axis) aggregated for countries for which this data is available for each continent. B) The 7-day rolling average of daily reported deaths coloured by the inferred proportion of variants, as calculated for case data, with an assumption of time lag of 20 days between infection and death applied (See more details in Materials and Methods). The dashed line displays the proportion of people fully vaccinated per region (scale on second y-axis) where those that received all doses prescribed by the initial vaccination protocol are considered fully vaccinated.

