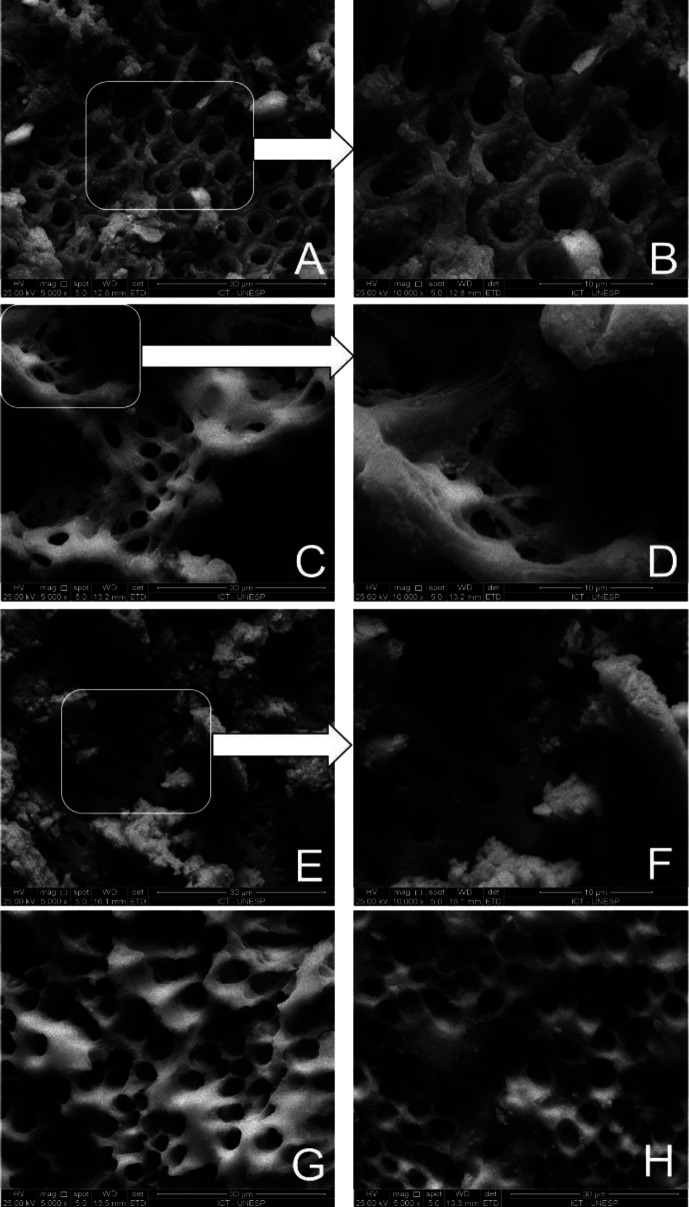
Figure 1.
Representative photomicrography of canal walls after treatment: A and B) Saline solution group (Positive control) showed the presence of E. faecalis in dentinal tubules entrance (original magnification, 5000× and 10000×, respectively); C and D) CH group showed presence of E. faecalis (original magnification, 5000× and 10000×, respectively); E and F) PDT group showed presence of E. faecalis (original magnification, 5000× and 10000×, respectively); G) NAC group showed absence of E. faecalis in canal walls and dentinal tubules (original magnification, 5000×); H) NAC+PDT group showed absence of E. faecalis in canal walls and dentinal tubules (5000×)

