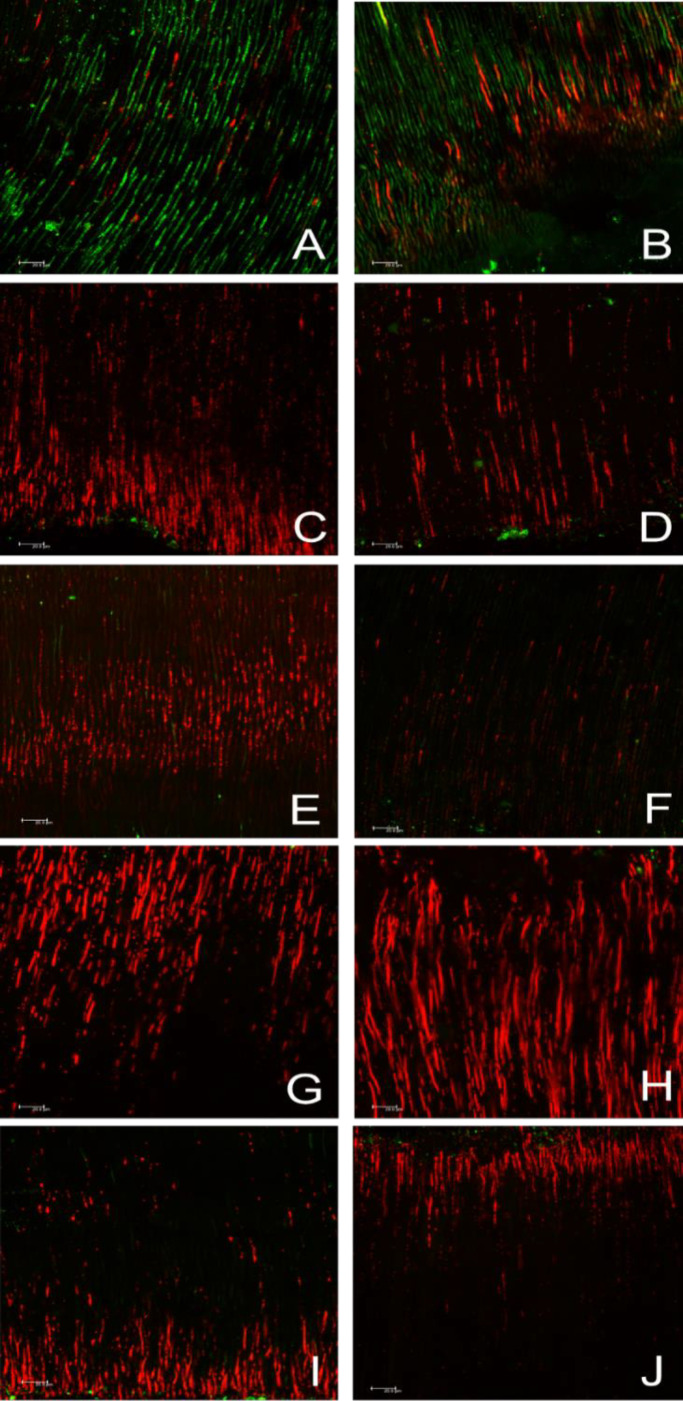
Figure 2.
Confocal laser scanning microscopy analysis of E. faecalis infected dentinal tubules after treatment: Illustrative images of dentinal tubules in the cervical (left column) and apical (right column) third, respectively, by CLSM after treatment with A and B) Saline solution; C and D) Ca(OH)2; E and F) PDT; G and H) NAC; I and J) NAC+PDT. Red stain indicates the presence of dead bacteria, while green stain represents live bacteria

