
Figure 2.
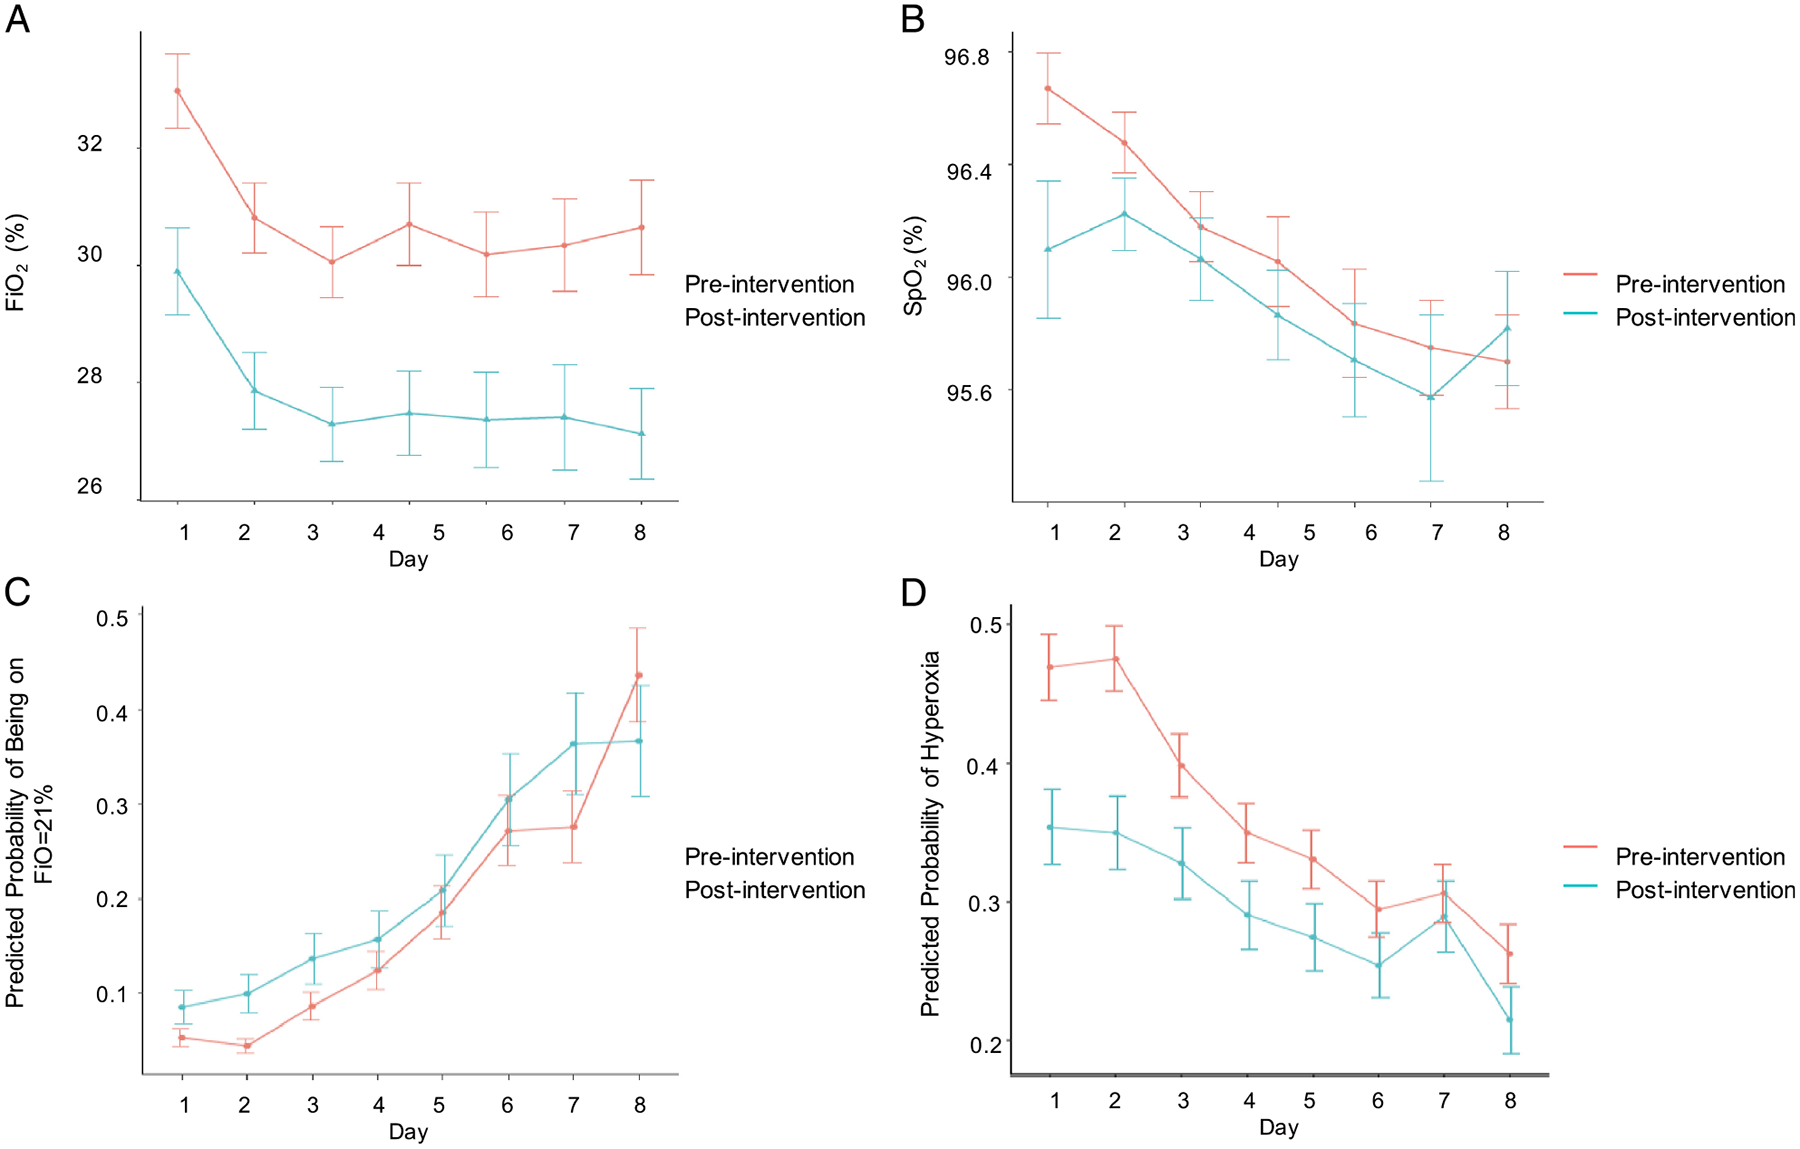
FiO2 and SpO2 over time. Comparison of the (A) mean FiO2 and (B) mean SpO2 by day in the preintervention and postintervention period. Data shown represent the mean value and SE of the mean. Comparison of the (C) predicted probability of being on room air (FiO2, 0.21) and (D) predicted probability of being hyperoxic (SpO2, >96%) and not on room air among the preintervention and postintervention period. Data shown represent the predicted probability with standard errors.