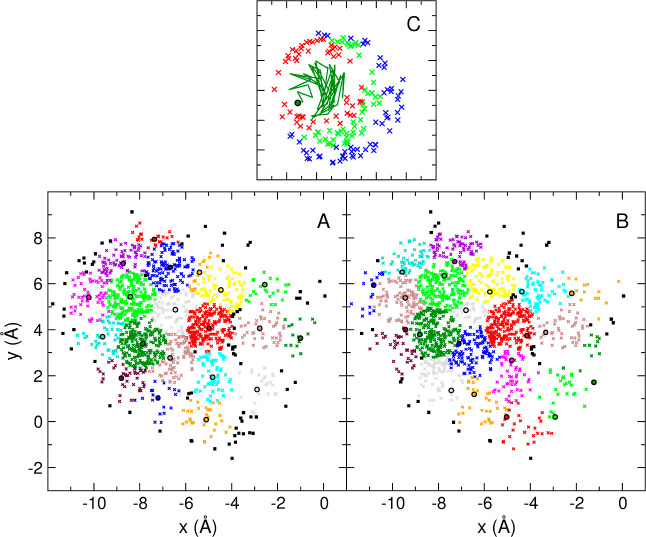
Figure 1.
Representation of the first 20 clusters of 1501 points in 2D. (A) RTC algorithm, θ = 1.1 Å. (B) QTC algorithm, θ = 2.2 Å. The color sequence is the same in both panels, starting with dark green for the first cluster. The seed elements of the clusters are indicated with a black circle (with the area matching the cluster color). Points belonging to clusters with an index higher than 20 are indicated as black squares. (C) Detail of the process of generation of cluster 1 from panel B (dark green): to illustrate this process, the points are shown in four different colors following their sequence of inclusion in the cluster. Thus, initial growth from the seed (dark-green circle) is indicated as a dark-green trajectory. Elements in red, light green, and blue correspond to successive phases in the growth of the cluster, in this order.

