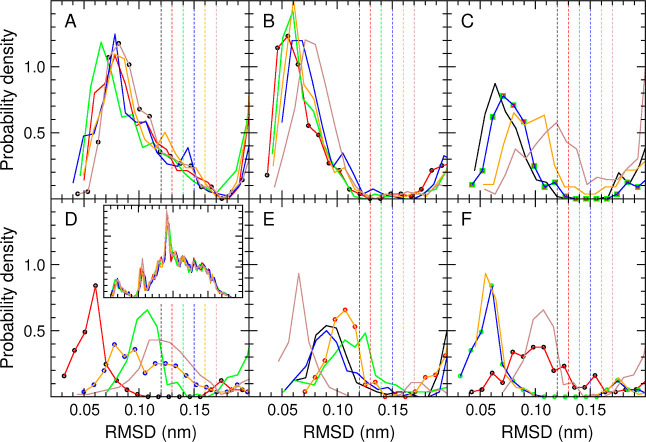
Figure 2.
rmsd distributions for the seeds of the six most populated clusters, after RTC clustering with six different thresholds. Each curve corresponds to the distribution of the rmsds between the given seed and all other 6000 configurations. The distributions are cut at 0.20 nm for clarity (the inset in panel D shows the full distributions from panel A as example). Panels A to F correspond to the distributions for the seeds of clusters 1 to 6, respectively. Each panel contains the distributions for six seeds, resulting from RTC clusterings with θr values of 0.12 (black), 0.13 (red), 0.14 (green), 0.15 (blue), 0.16 (orange), and 0.17 nm (brown). The dashed vertical lines show the positions of the thresholds (with colors matching the corresponding distributions). When two distributions overlap (i.e., clusterings with different thresholds produce the same seeds for the given cluster number), the overlapping curves are replaced by circles of the corresponding color.

