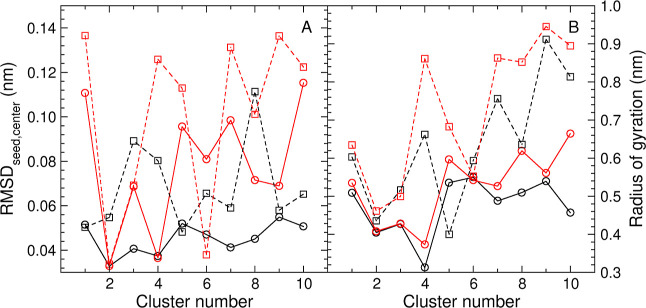
Figure 6.
Distance of the seed from the center and cluster compactness (lines between points are drawn only to help visually distinguish the four data sets in each plot.) (A) rmsd between the seed element and the center of geometry of the elements in the cluster. (B) Radius of gyration of the cluster. Black circles (black solid line): RTC clustering with θr = 0.12 nm. Red circles (red solid line): QTC clustering with θd = 0.20 nm. Black squares (black dashed line): RTC clustering with θr = 0.17 nm. Red squares (red dashed line): QTC clustering with θd = 0.25 nm.

