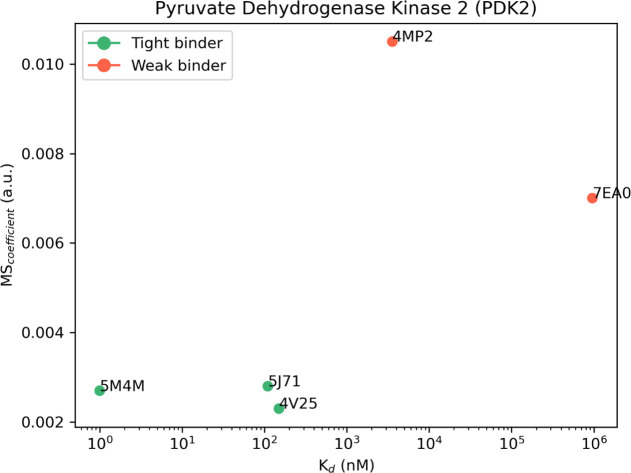
Figure 4.
Aggregate results of the TTMD simulations performed on the five investigated PDK2 complexes. On the horizontal axis, the experimentally determined affinity value (expressed as Kd) is reported, while on the vertical axis, the average MS coefficient is indicated. Each dot is color-coded as green or red and classified as a tight or weak binder based on the MS cutoff value of 0.004.

