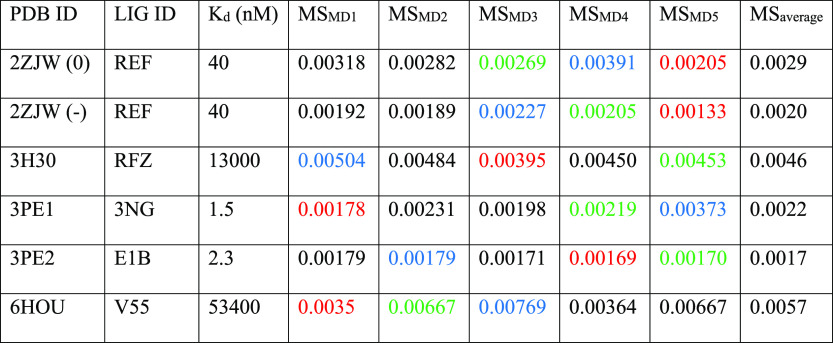
Table 3. Results for the TTMD Simulations Performed on the Five Investigated CK2 Complexesa.
For each protein–ligand complex, the PDB accession code, the ligand three-letter code, the experimentally determined affinity value, the MS coefficient for each simulation, and the average MS coefficient are reported. In each row, the lowest MS value is highlighted in red, while the highest value is highlighted in blue: both values were discarded for the calculation of the average MS coefficient reported in the last column. The most representative replicate, the one with the nearest MS coefficient to the average MS, is highlighted in green. For the complex 2ZJW, two different protonation states were independently considered in the simulations and are reported separately.

