
Figure 2. A comparison of the pathogenesis of orthopovirus infection.
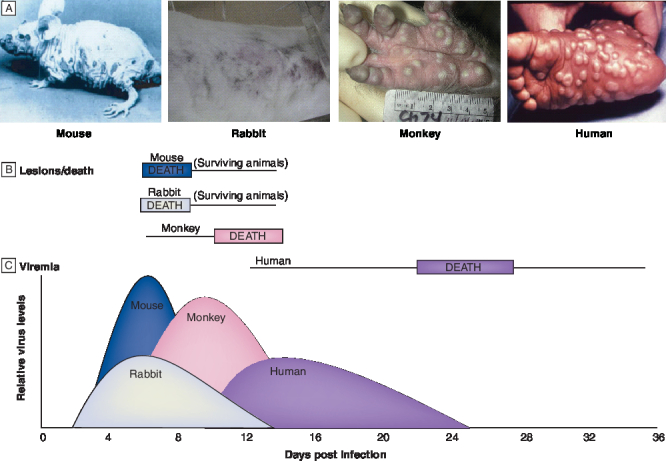
(A) Lesion formation caused by footpad inoculation of a naturally hairless mouse with 10 PFU of ectromella virus (ECTV) at day 6 post infection (courtesy of Zentralinstitut for Versuchstiere. Federal Republic of Germany) [47], intranasal inoculation of a rabbit with 150 PFU of rabbitpox virus (RPV) at day 6 post infection (reprinted with permission from Chaed Roy, US Army Research Institute for Infectious Disease [USAMRIID]), intravenous inoculation of a rhesus macaque with 106 PFU of monkeypox virus (MPV) at day 10 post infection (reprinted with permission from Jay Hooper, USAMRIID) [53], and variola virus (VARV) infection of a human at day 22 post infection [101]. (B) Diagram showing time of death (rectangles) and duration of lesion formation (lines) for orthopovirus infections of a mouse, rabbit, monkey or human. (C) Diagram showing the time of appearance of viremia detected in spleen (rabbit, mouse) or in throat swabs (monkeys, humans) and quantified by plaque assay (RPV, ECTV, MPV) in cell culture of chorioallantoic membranes (VARV). The height of the peaks represents relative levels of viral titers and was modified from previously published data [18,47,52,53].