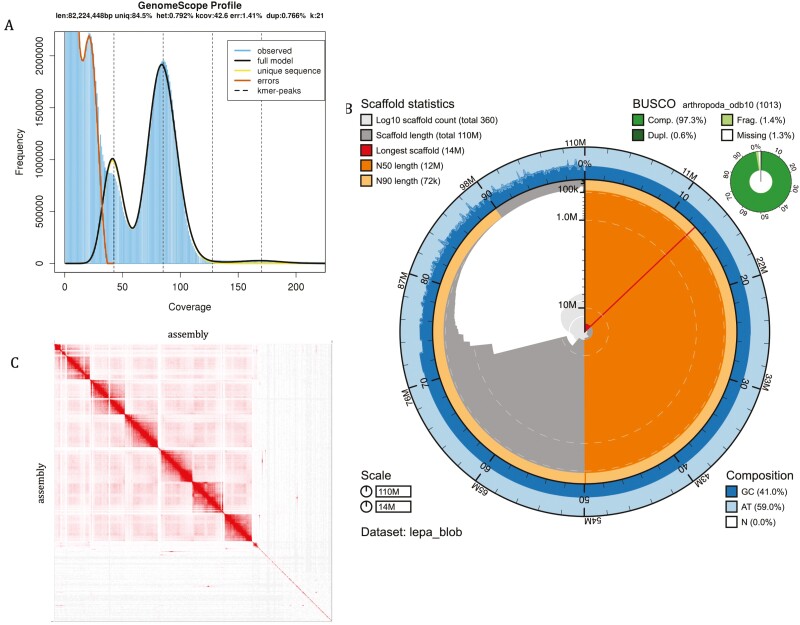
Fig. 2.
(A) Genomescope k-mer spectrum of Lepidurus packardi sequence reads. (B) BlobToolKit snail plot showing N50 metrics for L. packardi assembly and BUSCO scores for the Arthopoda set of orthologs. (C) Contact map of L. packardi assembly. This map demonstrates the ~70% of sequence length contained in chromosome-level scaffolds, as well as the remaining sequence length clustered into contigs.

