Figure 3.
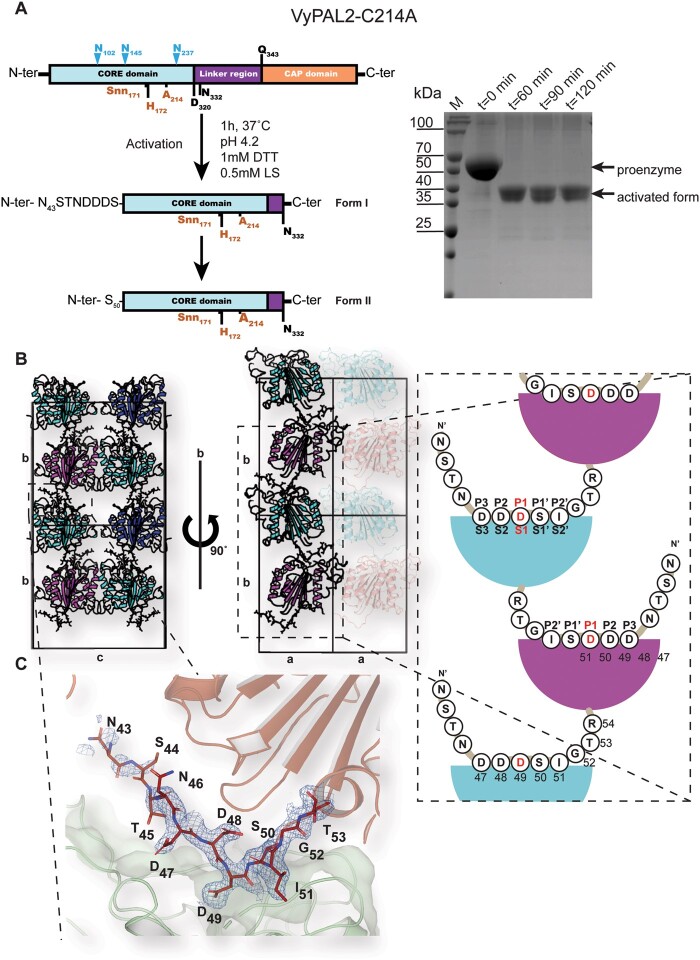
Expression, maturation, and crystal structures of VyPAL2-C214A. A, left: Schematic representations of VyPAL2-C214A sequences. Before activation (upper diagram), following acid-induced activation and crystallization (middle and lower diagrams, respectively). Residues visible in the electron density map are displayed in bold, while residues immediately at the N-terminus likely to be cleaved are in plain font. B, Schematic diagram of crystal packing showing how VyPAL2-C214A molecules are stacked in the monoclinic C2 unit cell. Molecules related by a unit-cell translation along b are displayed as ribbons of the same color, whilst molecules related by the two-fold axis along the same axis are displayed in green and pink (middle). The N-terminal tail of each molecule inserts in the molecule stacked underneath. C, The N-terminal peptide bound to the enzyme. The molecular surface of the peptide ligase is displayed in gray. Overlaid is a Fourier difference map displayed as a blue mesh with coefficients 2Fo–Fc, with phases from the refined model, contoured at a level of 1σ over the mean.

