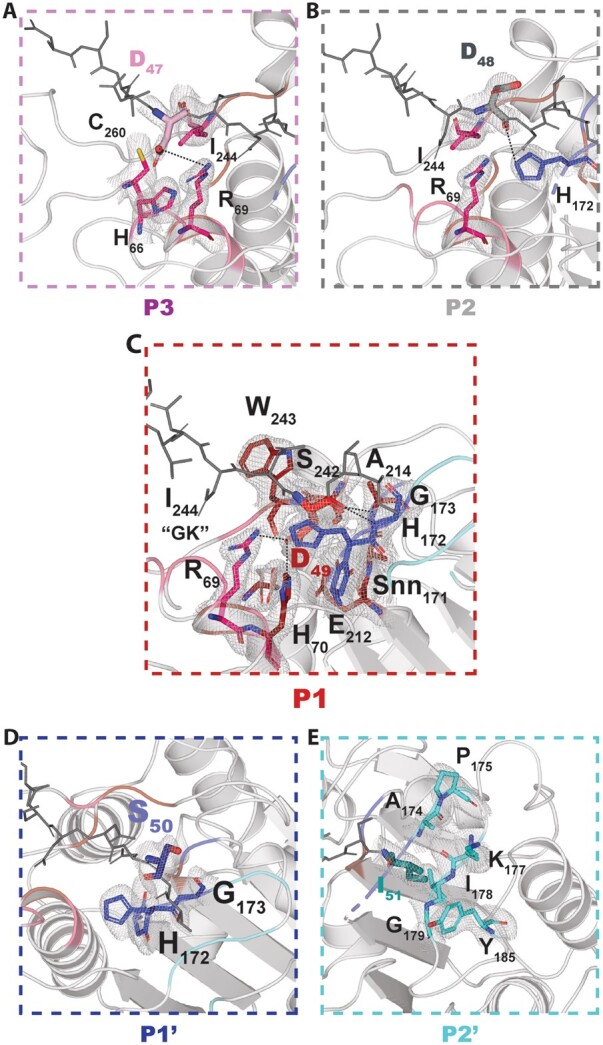
Figure 4.

Detailed views of the ligase specificity pockets. Magnified views of the S3–S2′ specificity pockets of VyPAL2. For each pocket, the cognate peptide substrate (sticks) is colored in wheat (A, P3), gray (B, P2), red (C, P1) blue (D, P1′), and cyan (E, P2′), while the rest of the peptide is in gray. Residues from the specificity pockets are colored in magenta (A, S3), red (B, S2), red (C, S1) blue (D, S1′), and cyan (E, S2′) and are shown as sticks and labeled. Polar interactions between the substrate residues and residues lining the specificity pockets (hydrogen bonds or salt bridges) are depicted as dashed lines. Overlaid is a Fourier difference map displayed as a blue mesh with coefficients 2Fo–Fc, with phases from the refined model, contoured at a level of 1σ over the mean.
