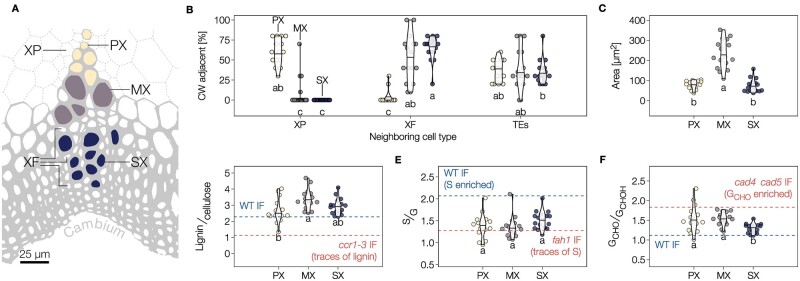
Figure 3.
Different TE morphotypes in annual plants have specific morphological features and lignin chemistry. A, Schematic diagram of the localization of the three TE types in vascular bundles of Arabidopsis stems according to their distance to the cambium: PX in yellow, MX in purple and SX in blue. Each TE morphotype shares different proportions of XFs and XP surrounding each TE type. B, Relative proportion of adjacent cell types for each TE morphotype. Note that the proportion of neighboring TEs remains constant independently of the TE morphotype. Different lowercase letters indicate significant differences according to a Kruskal–Wallis test followed by Dunn’s multiple comparison ( = 0.05). C, Lumen area of each TE morphotype determined from cross-sections. D, Relative lignin to cellulose ratio measured by Raman microspectroscopy. E, Relative S to G ratio measured by Raman microspectroscopy. F, Relative GCHO to GCHOH ratio measured by Raman microspectroscopy. Because range and intercept of Raman band ratios differ from other biochemical analyses but still maintain a linear relationship (Agarwal, 2019; Blaschek et al., 2020b), references are presented for each lignin parameter using interfascicular fibers (IF) in WT and relevant mutants. Different lowercase letters in panels C–H indicate significant differences according to a Tukey-HSD test (per panel; = 0.05); n = 15–17 individual cells per TE type in three plants.

