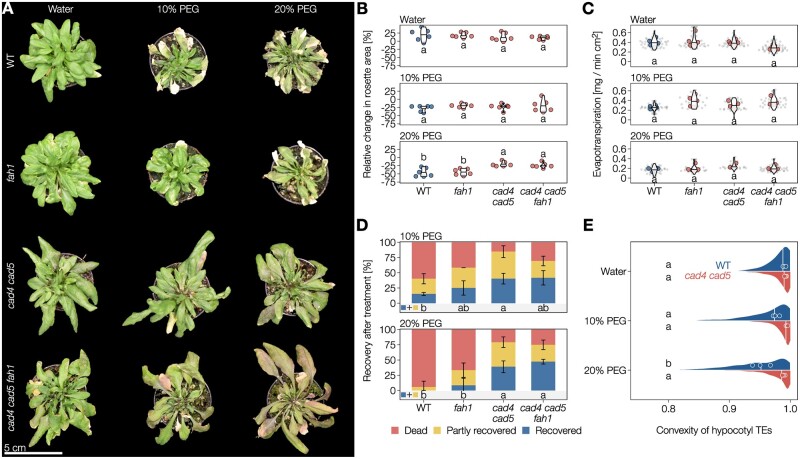
Figure 7.
Coniferaldehyde-induced flexibility of TE lignin improves plant resistance and/or recovery from extreme differentials. A Top view of 4- to 5-week-old Arabidopsis WT, S-depleted fah1, GCHO-overaccumulating cad4 cad5, and S-depleted and GCHO-overaccumulating cad4 cad5 fah1 mutant plants after being irrigated with water, 10% PEG6000 or 20% PEG6000 for 3 d. B, Relative change in projected rosette leaf area after 3 d of treatment with water, 10% PEG or 20% PEG, followed by 3 d recovery in water. Different lowercase letters indicate significant differences according to a Tukey-HSD test (per panel; α = 0.05); n = 6 plants per genotype and treatment. C, Evapotranspiration rates (normalized to the projected leaf area right before beginning of treatment) after irrigation with water, 10% PEG or 20% PEG for 3 d. Small gray dots represent individual measurements, larger colored dots represent the average per plant. Different lowercase letters indicate significant differences according to a Tukey-HSD test (per panel; α = 0.05); n = 3–6 plants per genotype and treatment. D, Proportion of plants that did not, partly or fully recover from treatment (with water, 10% PEG or 20% PEG for 3 d) after a 3-d recovery period in water-saturated soil. Different lowercase letters indicate significant differences in the proportions of plants that at least partly recovered according to a Tukey-HSD test (per panel; α = 0.05); n = 12–20 plants per genotype and treatment from two to three independent experiments. E, TE collapse in hypocotyls after PEG treatment and subsequent recovery in water. The distribution and median lines represent all measured TEs, median convexity for each individual plant is indicated by points. Different lowercase letters indicate significant differences between genotypes and treatments according to a Tukey-HSD test (α = 0.05); n = 3 individual plants per genotype and treatment.

