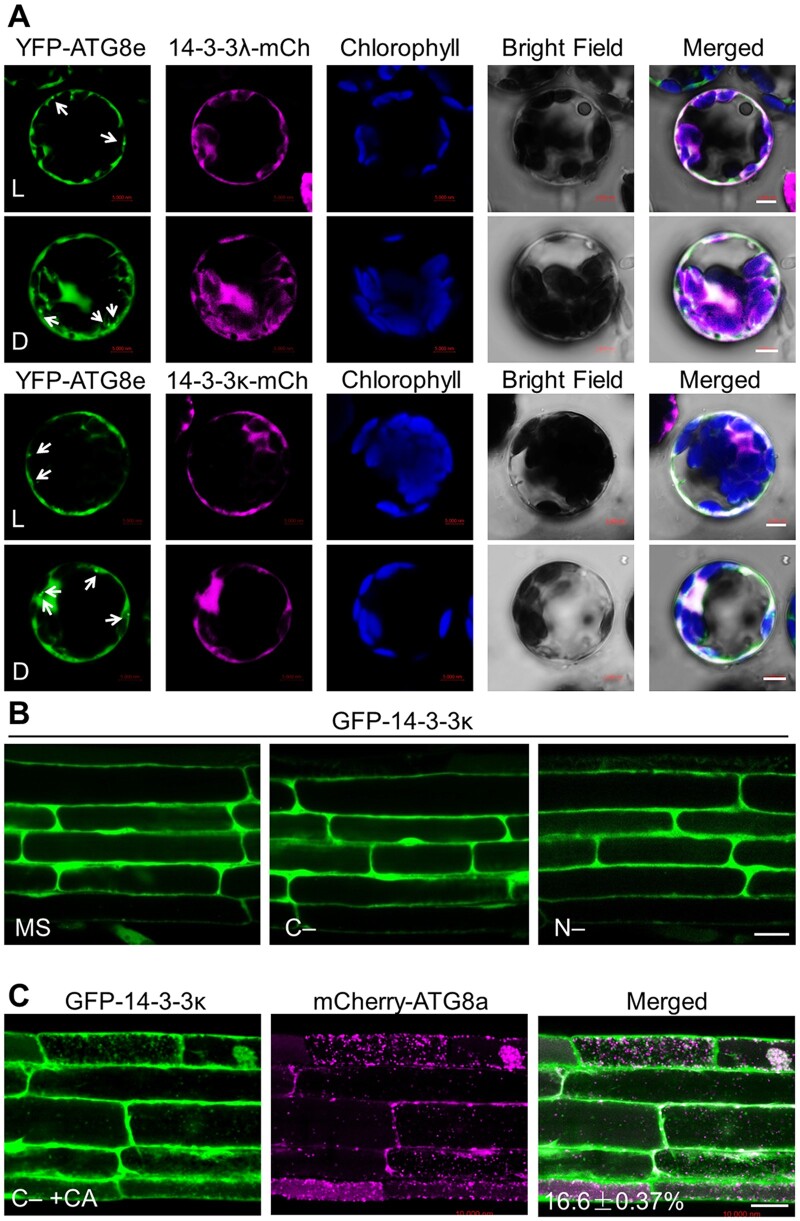
Figure 2.
Subcellular distribution of 14-3-3 proteins. A, Colocalization of mCherry-tagged 14-3-3λ (14-3-3λ-mCh) or 14-3-3κ (14-3-3κ-mCh) fusions with the autophagy marker YFP-ATG8e in Arabidopsis protoplasts under light (L) or dark (D) conditions. The 14-3-3λ-mCherry or 14-3-3κ-mCherry construct was co-transfected with YFP-ATG8e into Arabidopsis protoplasts and incubated for 16 h, followed by confocal microscopy analysis. Arrows indicate ATG8-labeled autophagic puncta. Confocal images obtained from GFP, mCherry, chlorophyll autofluorescence, brightfield, and merged images are shown. Scale bars, 5 µm. B, Examination of GFP-14-3-3κ subcellular distribution pattern. One-week-old transgenic seedlings expressing GFP-14-3-3κ and grown on MS medium under normal growth conditions (16-h light/8-h dark) were exposed to C- and N-sufficient (MS) or C- or N-deficient (C– or N–) conditions for 16 h. GFP fluorescence was observed by confocal microscopy. Scale bar, 20 µm. C, Evaluation of the colocalization between GFP-14-3-3κ and the autophagy marker mCherry-ATG8a in transgenic plants expressing GFP-14-3-3κ and mCherry-ATG8a. Transgenic seedlings expressing GFP-14-3-3κ and mCherry-ATG8a were grown on MS medium under normal growth conditions for 6 days before being exposed to C-sufficient (MS) or C-deficient conditions in the presence of 1 µM CA (C–+CA) for 16 h. GFP and mCherry fluorescence was then visualized by confocal microscopy. The number in the merged image indicates the colocalization ratio (number of colocalization puncta over total GFP-14-3-3λ puncta). The percentage is the mean ± sd (n = 3) of three independent experiments. For each experiment, three images were used for analysis. Scale bar, 20 µm.

