Figure 5.
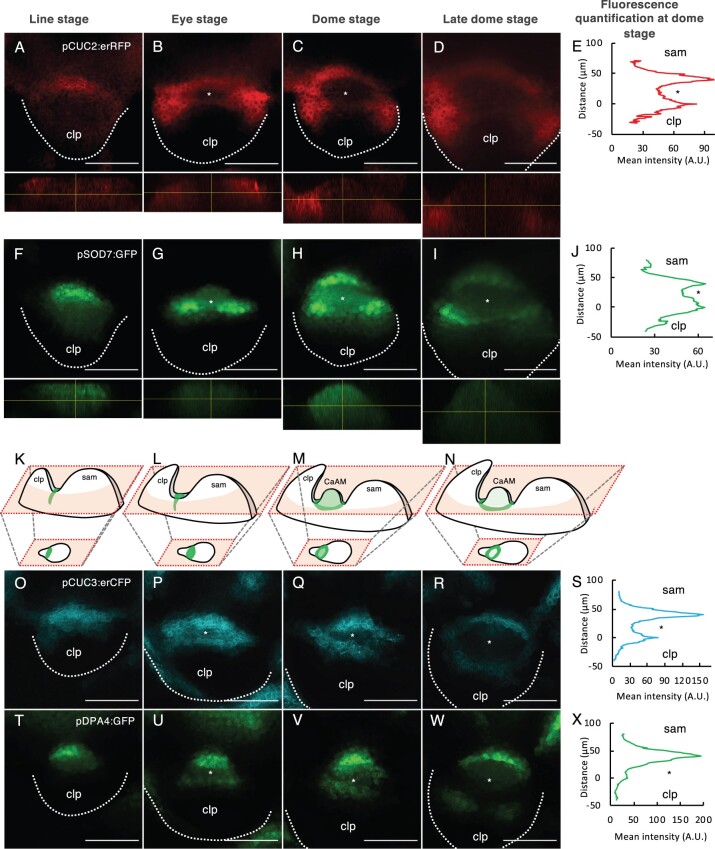
DPA4 and SOD7 have overlapping expression patterns with CUC2 and CUC3 in the boundary domain and are transiently expressed in the early AM. A–D and F–I, Maximum projections of transverse optical sections of plants co-expressing pCUC2:erRFP (A–D) and pSOD7:GFP (F–I) reporters. Orthoslices through the developing AM are shown below the transverse sections. E and J, Mean fluorescence along the radial axis of CaAM at the dome stage of the pCUC2:erRFP (E) or pSOD7:GFP (J) reporters (n = 6). K–N Schemes showing the 3D structures of the apex with the SAM, the cauline leaf primordium and the developing CaAM. Schemes of the expression patterns of SOD7 are shown. The schemes of the optical sections are shown below. Scheme K corresponds to (F), scheme L to (G), and so on. O–R and T–W, Maximum projections of transverse optical sections of plants co-expressing pCUC3:erCFP (O–R) and pDPA4:GFP (T–W) reporters. S and X, Mean fluorescence along the radial axis of CaAM at the dome stage of the pCUC3:erCFP (S) or pDPA4:GFP (X) reporters. A.U. = arbitrary units (n = 6). CaAMs are at the (A, F, O, and T) line, (B, G, P, and U) eye, (C, H, Q, and V) dome and late dome stage (D, I, R, and W). Scale bars = 50 µm; clp: cauline leaf primordium; asterisks: AM; The dotted lines correspond to the outlines of the cauline leaf primordia.

