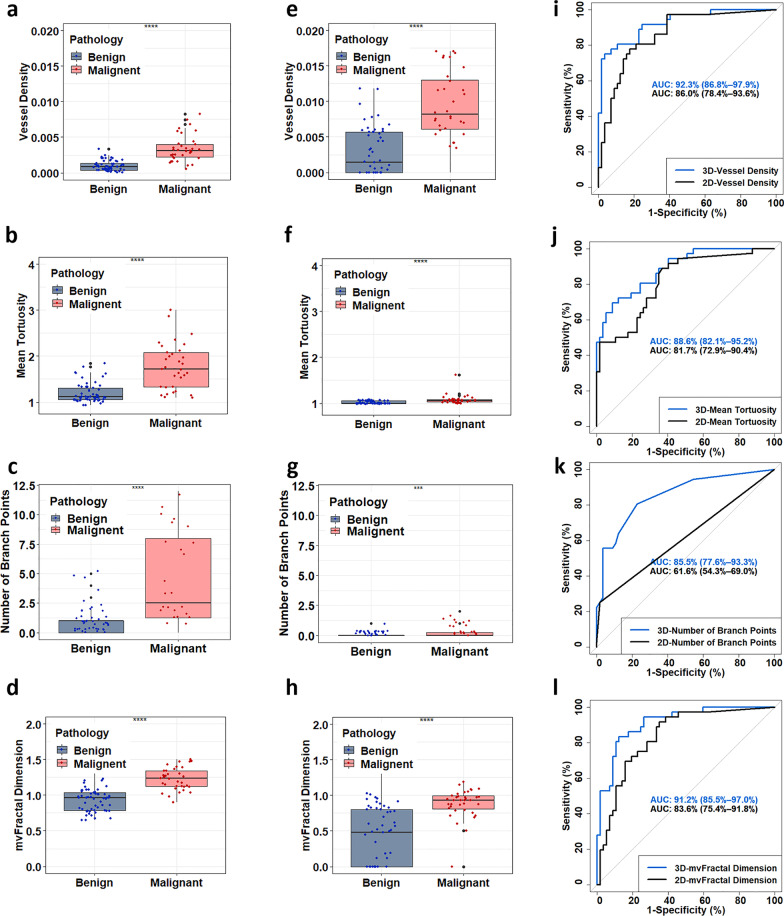
Fig. 3.
Comparison of the quantitative parameters between benign and malignant lesions obtained with q2D- and q3D-HDMI and the ROC curves. Parameters of q3D-HDMI are shown in first column: a vessel density, b number of branches, c mean tortuosity, and d microvessel fractal dimension. Parameters of q2D HDMI are shown in second column: e vessel density, f number of branches, g mean tortuosity, and h microvessel fractal dimension. Comparison of the ROC curves between q2D HDMI and q3D HDMI generated with i vessel density, j number of vessel segments, k mean tortuosity, and l microvessel fractal dimension. HDMI = high-definition microvasculature imaging

