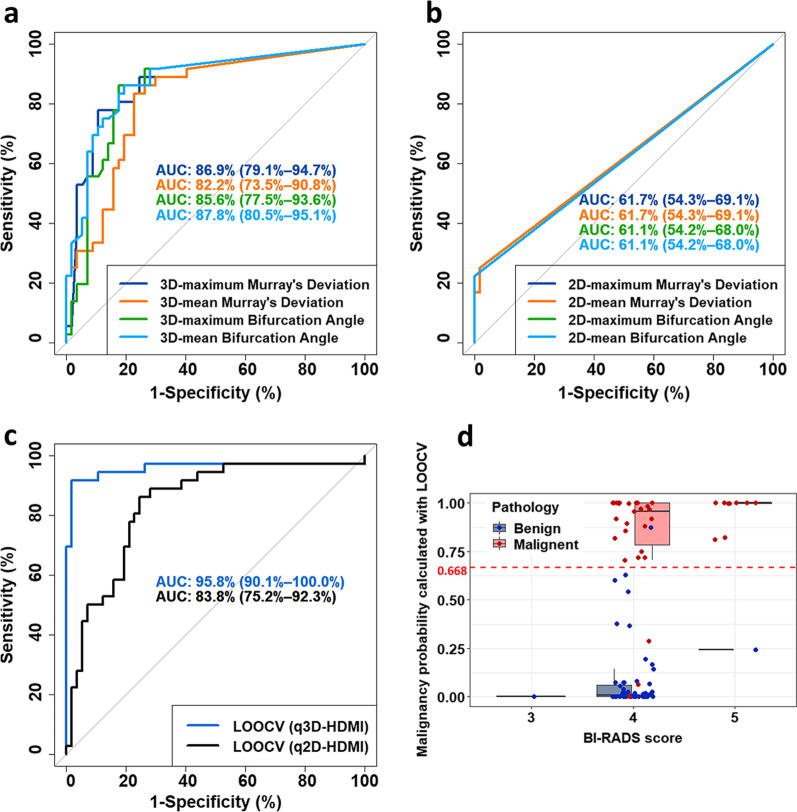
Fig. 5.
a ROC curves generated with MDmax, MDmean, BAmax and BAmean obtained from 3D high-definition microvasculature imaging (q3D-HDMI). b ROC curves generated with MDmax, MDmean, BAmax and BAmean obtained from 2D high-definition microvasculature imaging (q2D-HDMI). c ROC curves generated with the leave-one-out cross-validation (LOOCV) method for q2D-HDMI and q3D-HDMI method. For both q2D-HDMI and q3D-HDMI, quantitative parameters VD, mvFD, τmax, NV, NB, Dmean were included in the LOOCV model. d Boxplot of the distribution of the malignancy probability for each lesion in each BI-RADS category. The coefficients included in the equation for calculating the malignancy probability were obtained with LOOCV. The malignancy probability was calculated with LOOCV for the q3D HDMI. The dashed red line indicates the cutoff for differentiating benign from malignant lesions. The red dots represent the malignant lesions, and the blue dots represent the benign lesions. HDMI = high-definition microvasculature imaging. ROC = receiver operating characteristic. LOOCV = Leave-one-out cross-validation

