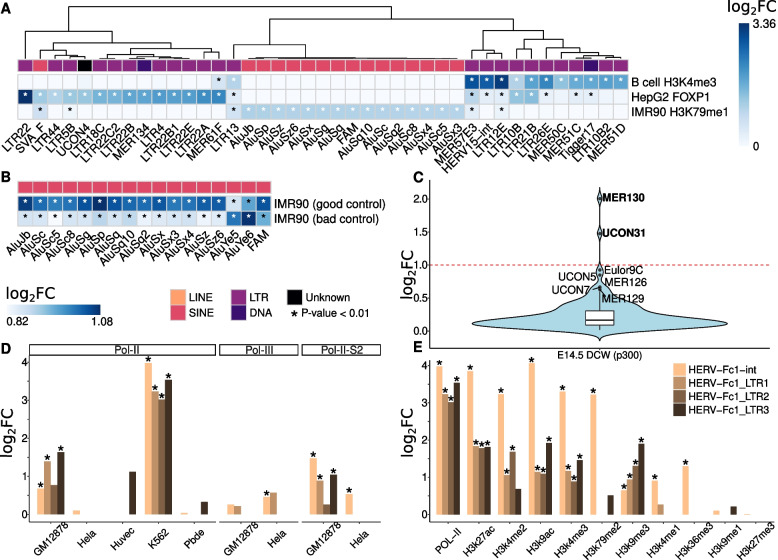
Fig. 4.
T3E characterises epigenetic profile of TE families/subfamilies in cell type-specific scenarios. A The heatmap shows the FCs of the TE families/subfamilies that T3E detected as enriched (P-value < 0.01) with FC > 2 in at least one ChIP-seq experiment of Dataset 1. P-values < 0.01 are indicated by asterisks; FCs > 2 are shown with white asterisks. White-coloured cells represent no signal. Columns are clustered using Euclidean distance and complete linkage. TE families/subfamilies are enriched in a cell type- and ChIP target-specific manner. Mainly SINEs are enriched in the IMR-90 cell line and essentially LTRs are enriched in B-cell and HepG2 cell types. B The heatmap shows the FCs of the TE families/subfamilies that T3E detected as enriched (P-values < 0.01) with FC > 2 in at least one of two different ChIP-seq input controls. White asterisks indicate FC > 2. Input control quality impacts on the Fold-Change level of enrichments but does not change the biological interpretation of the results. C Enrichment for the transcriptional co-activator p300 in the dorsal cerebral wall (DCW) of E14.5 mouse embryos. Only 130 (out of 997) TE families/subfamilies with P-value < 0.01 are represented. Mild outliers (lying between 1.5 times and 3 times the interquartile range above the third quartile) are indicated by their names; only MER130 and UCON31 feature FC > 2. Ancient TE families/subfamilies might have been co-opted as cis-regulatory elements important to the development of the mammalian neocortex. D-E Enrichment HERV-Fc1 subfamilies for polymerases and histone marks in two normal (Huvec, Pbde) and three transformed and cancer cell lines (Hela, GM12878, K562). Asterisks represent P-values < 0.01. HERV-Fc1 subfamilies (coloured differently) feature higher enrichment for Pol-II in the K562 CML cell line compared to other cell lines and active chromatin histone marks (H3K27ac, H3K4me2, H3K9ac, H3K4me3, H3K79me2, H3K4me1 and H3K36me3) present higher levels of HERV-Fc1 subfamilies compared with histone marks associated with repressed chromatin (H3K9me1, H3K9me3 and H3K27me3) for Pol-II in the K562

