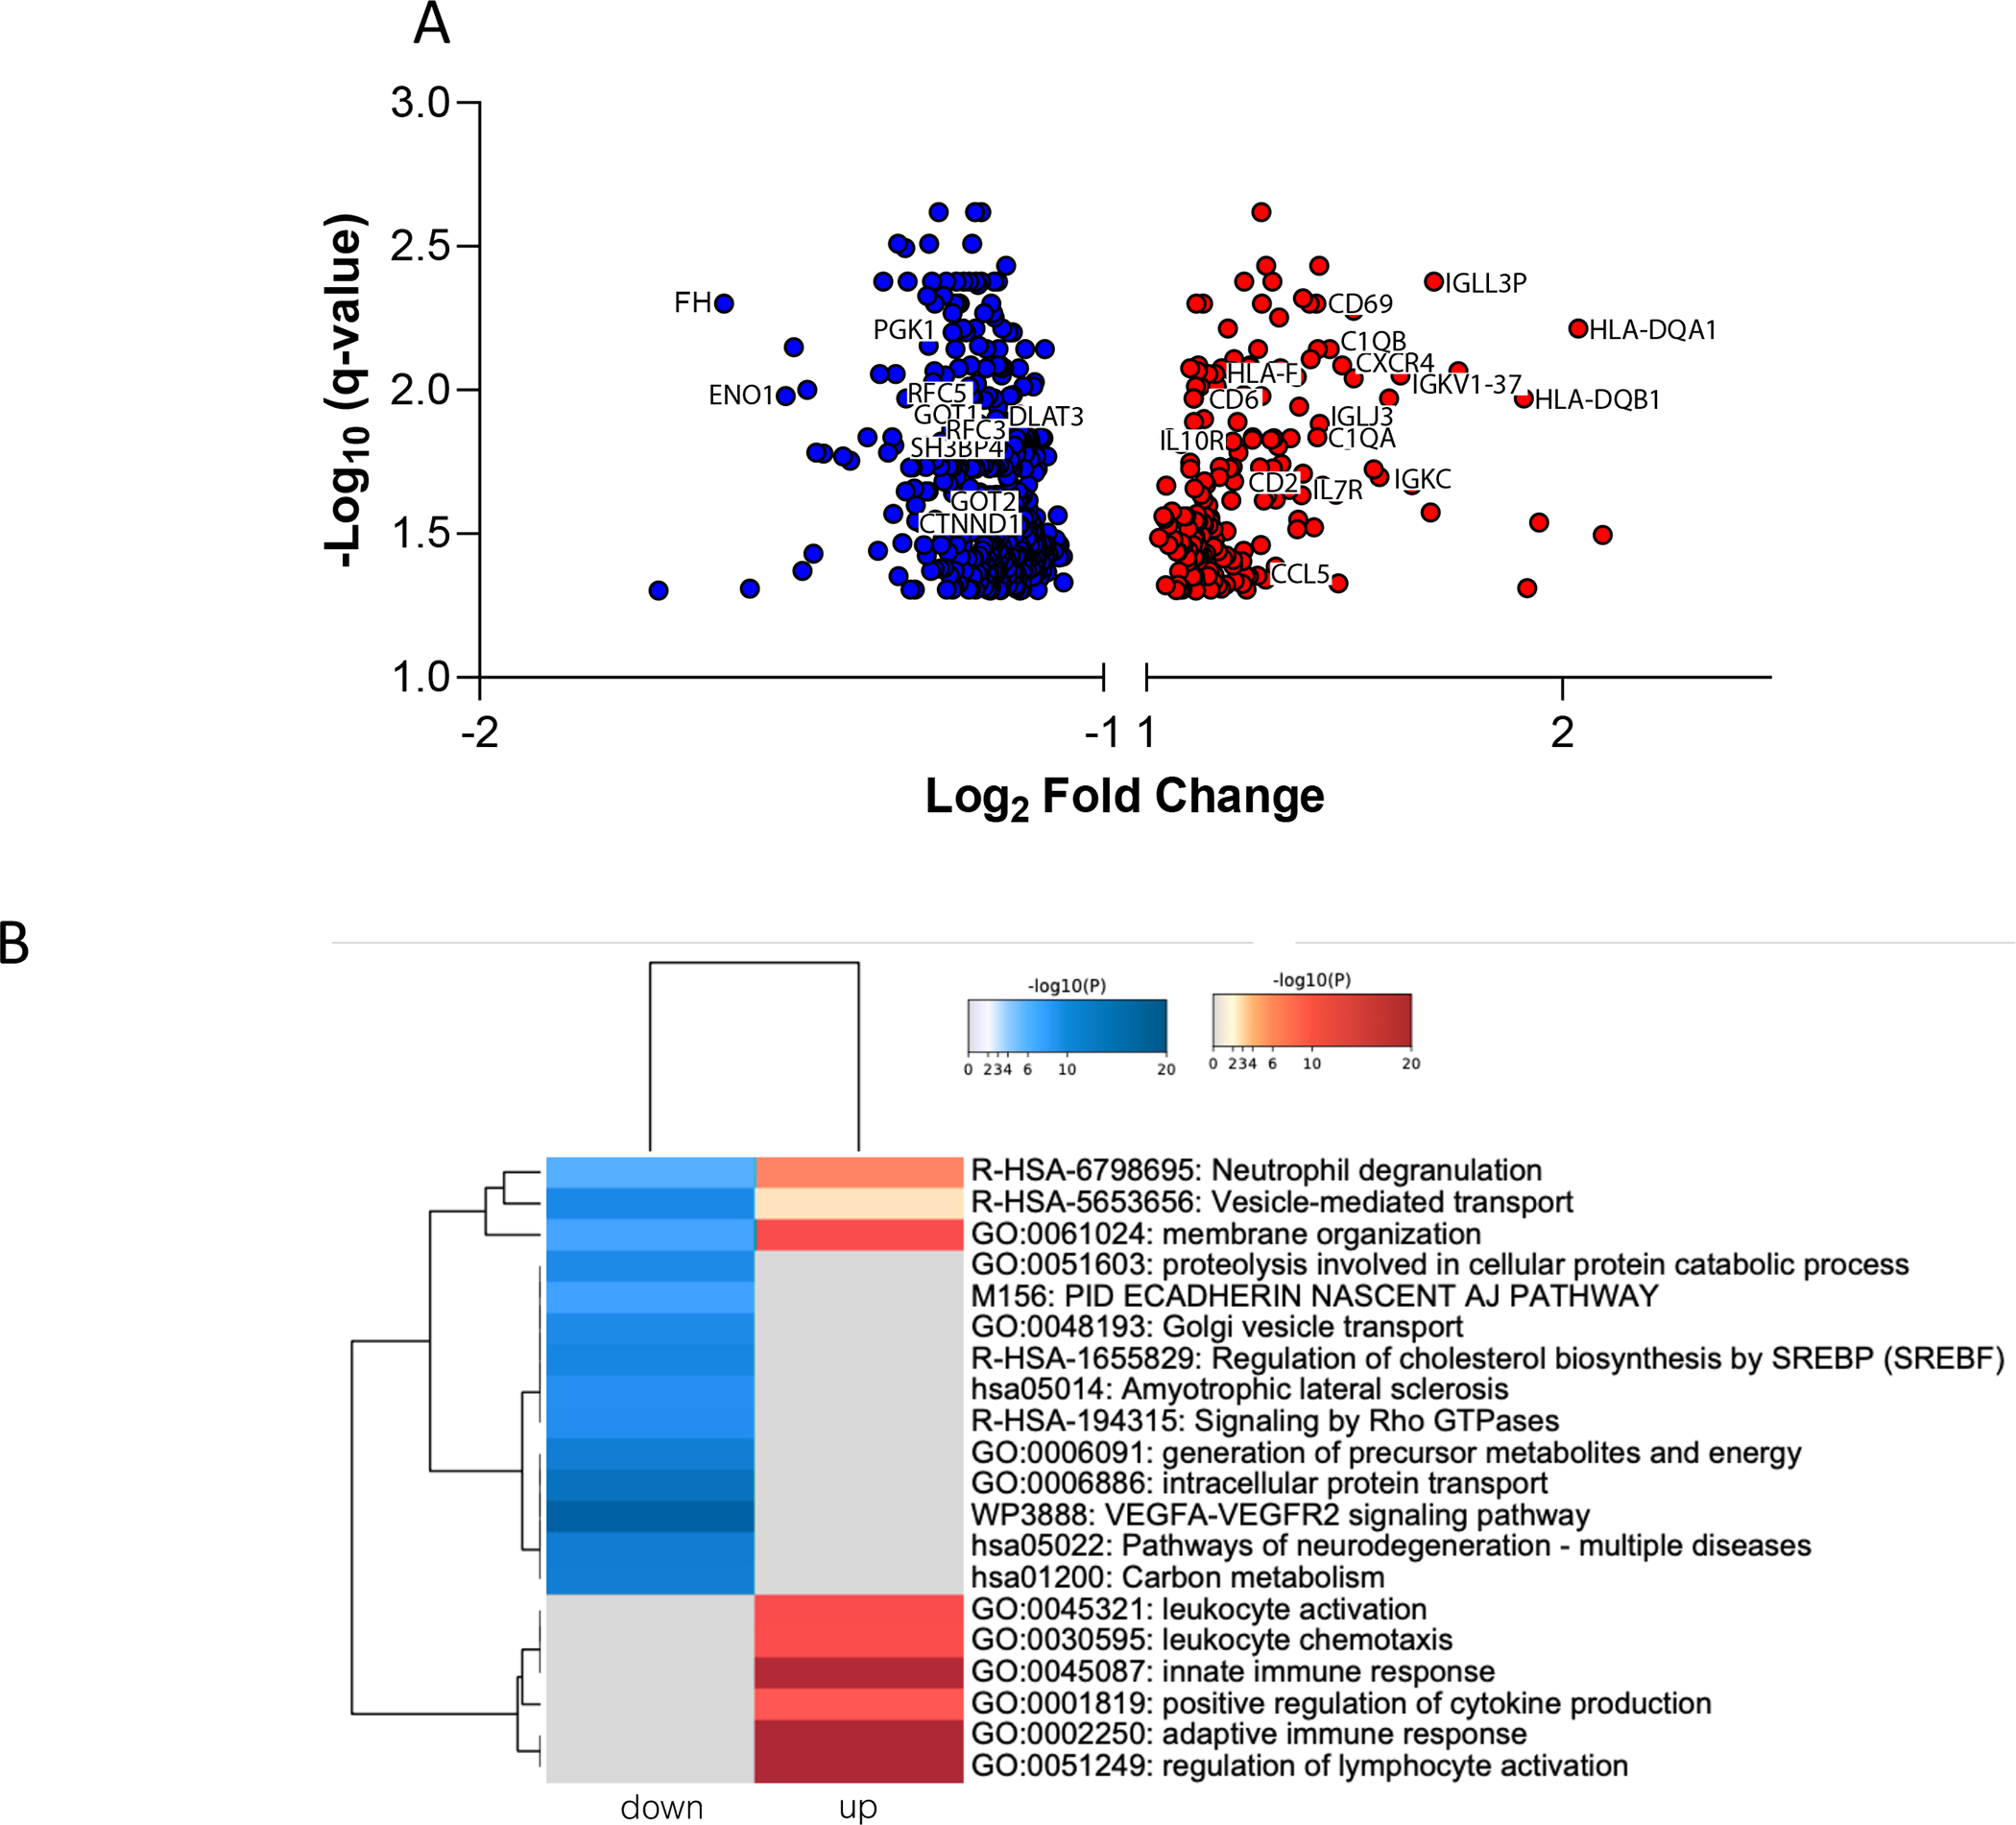
Figure 1.

A. Volcano plot showing fold changes and the adjusted p-values for all differentially expressed genes between groups at pre-transplantation. The red dots represent down-regulated genes and blue dots represent up-regulated genes in low-functioning kidneys. B. Heatmap of top enriched biological pathways in low-functioning kidneys, colored by p-values. Grey values indicate no detected expression patterns.
