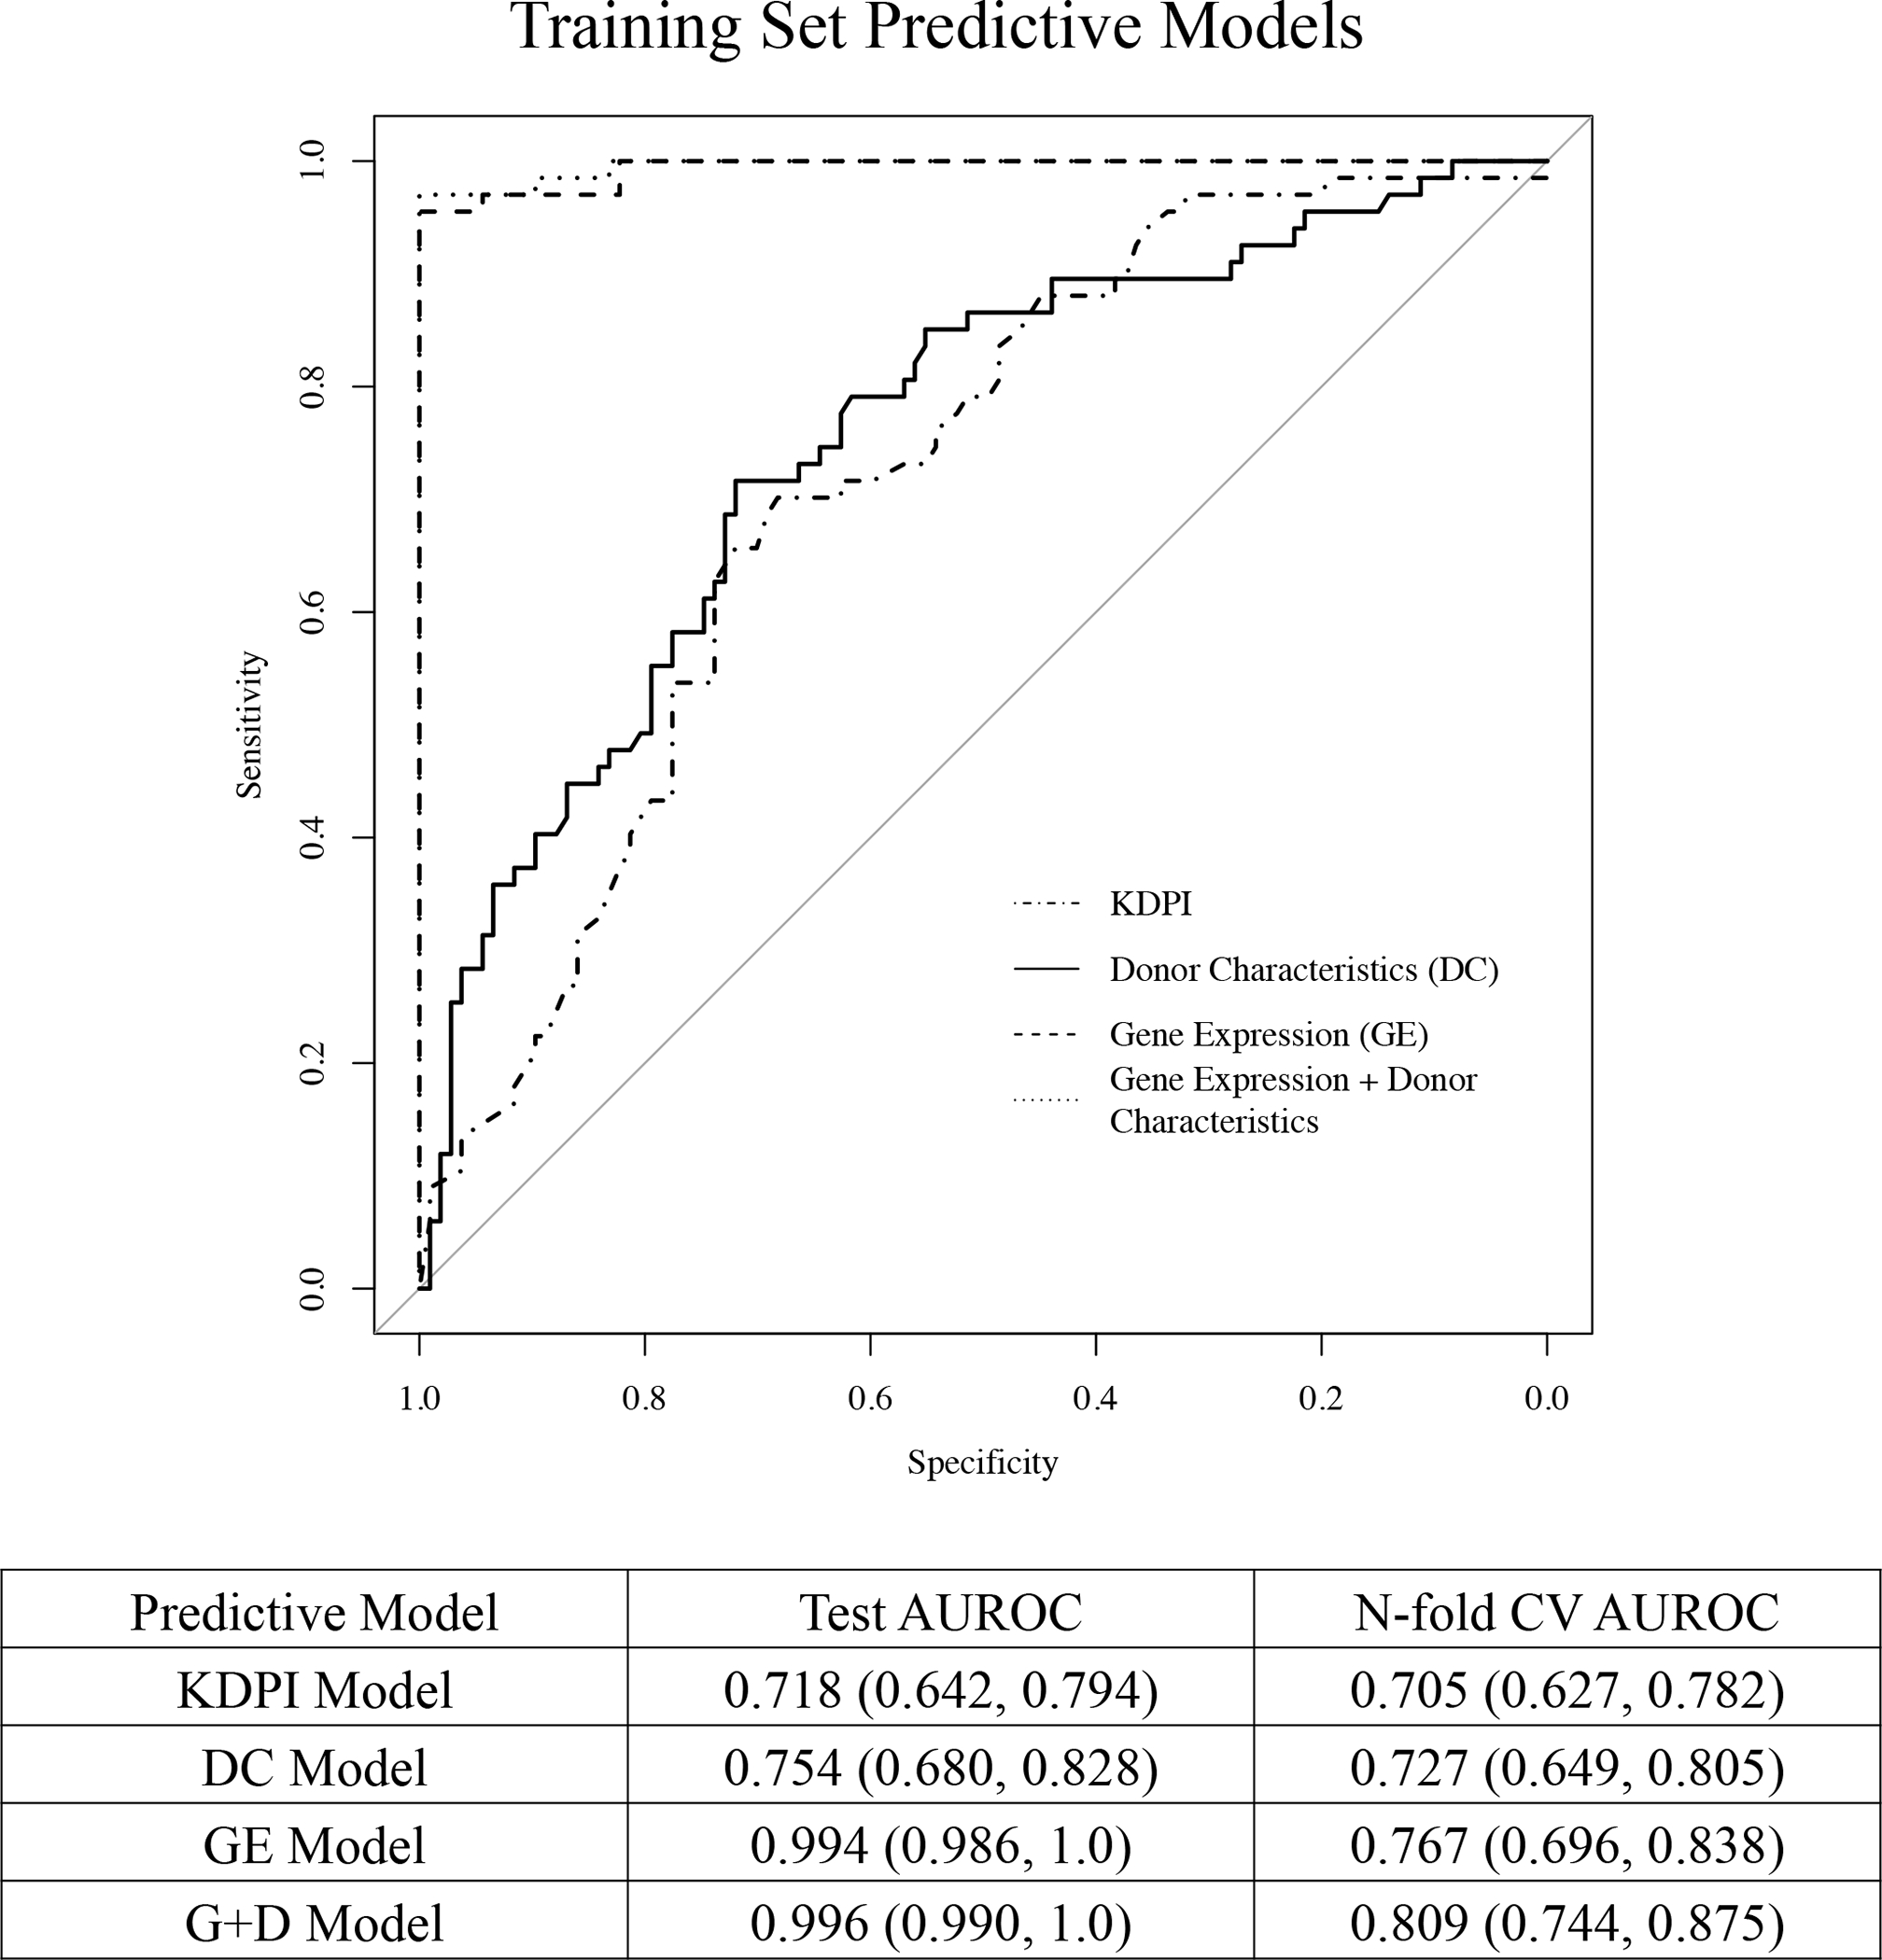
Figure 3.

Area under the receiver operating characteristic (AUROC) curves for the training data for the donor characteristics (DC) model, gene expression (GE) model, gene expression + donor characteristics (G+D) model, and the KDPI model in predicting high vs. low eGFR group 24-months posttransplant. The diagonal line represents performance of a chance model.
