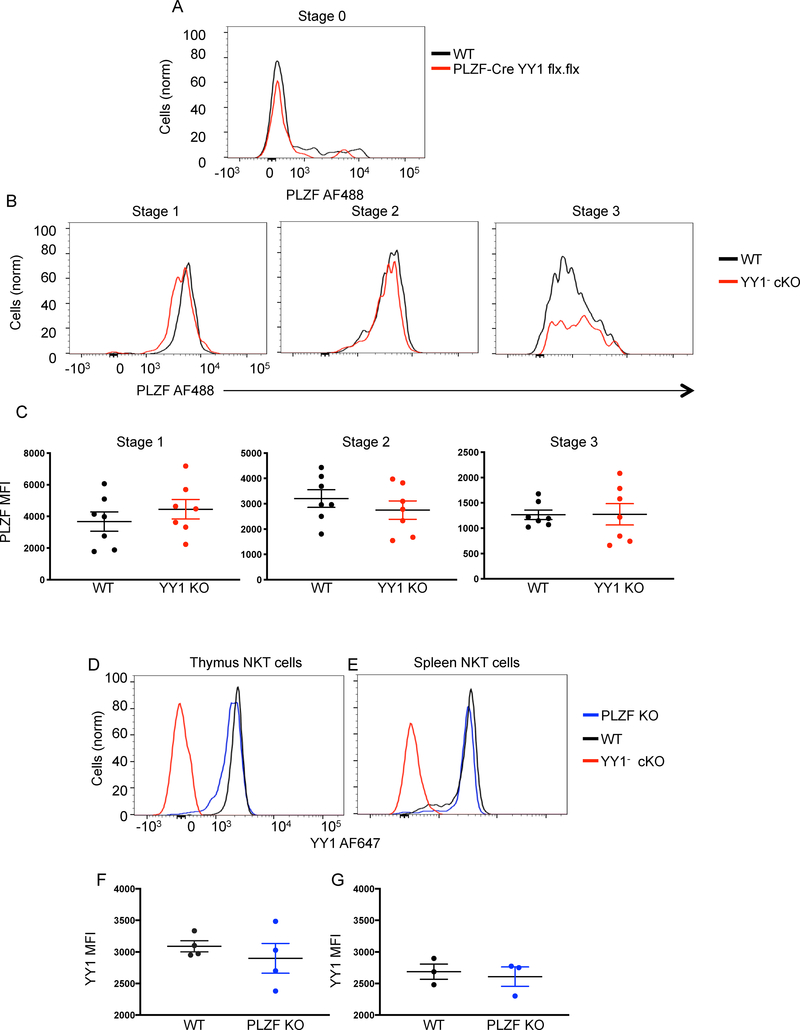
Figure 3. PLZF and YY1 expression are independent.
The indicated tissues were collected from C57BL/6 (WT) mice, PLZF-Cre YY1 flx.flx mice or PLZF KO mice and analyzed by FACS with the indicated antibodies. (A) PLZF expression was determined by flow cytometry and compared between WT Stage 0 NKT cells (MHCII−, CD3+, CD1dtet+, CD24+) and Stage 0 NKT cells isolated from PLZF-cre YY1 flx.flx mice. (B, C) PLZF expression was determined by flow cytometry and compared between WT NKT cells and YY1− cKO at the same developmental stage. Representative histograms are shown in (B). Cumulative MFI data for PLZF are plotted in (C). NKT cell stages were defined as follows: Stage 1 (CD24−, CD44−, NK1.1−) (left), Stage 2 (CD24−, CD44+, NK1.1−) (middle), and Stage 3 (CD24−, CD44+, NK1.1+) (right). NKT cells isolated from the thymus (D, F) and spleen (E, G) of WT mice and PLZF KO mice were stained for YY1. Representative histograms of YY1 expression are shown in (D and E). Pooled data concerning the MFI of YY1 are shown in (F and G). Each symbol (C, F, G) represents an individual mouse. Data are from 3 or more independent experiments representing (C) 7, (F) 4, or (G) 3 biological replicates. The horizontal lines indicate the mean (±s.e.m.). P values determined by Mann Whitney U-Test (C, F, G).

