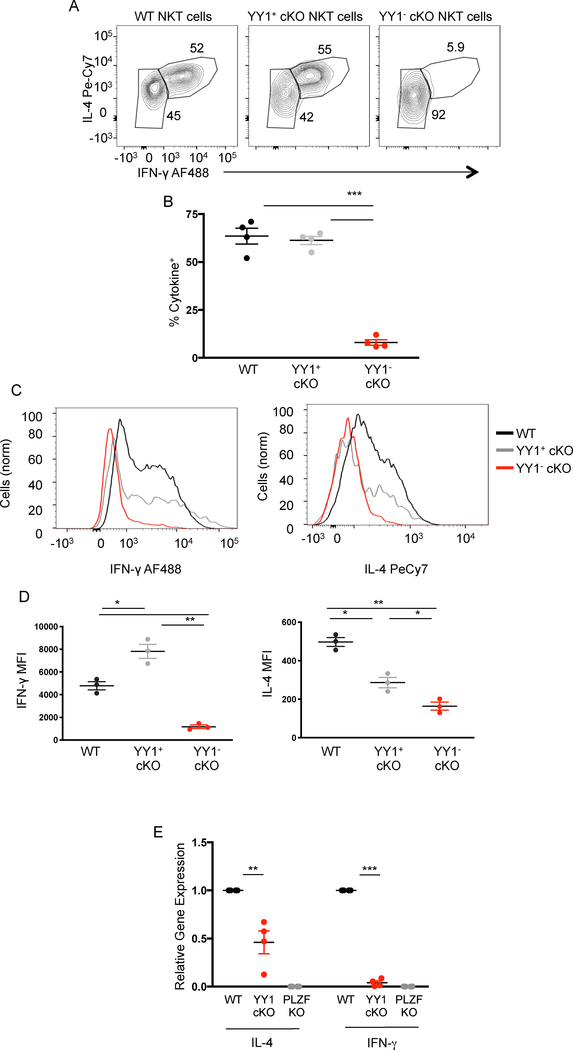
Figure 4. YY1 deficient NKT cells do not produce cytokines upon primary activation.
(A, B) C57BL/6 (WT) and PLZF-cre YY1 flx.flx (YY1 cKO mice) were injected I.V. with α-GalCer (10ug) suspended in saline. 90 minutes after injection, splenic NKT were harvested and stained for IL-4 and IFN-γ. Representative FACs plot depicting IL-4 and IFN-γ expression in WT NKT cells (MHCII−, CD3+, CD1dtet+, CD24−), YY1− cKO NKT cells, and YY1+ cKO NKT cells are depicted in (A) and cumulative data from 4 experiments are shown in (B). (C, D) NKT cells isolated from the spleens of WT and YY1 cKO mice were activated in vitro for 5 hours by culture with PMA (50ng/mL) and Ionomycin (500n/mL). Activated NKT cells were stained for IL-4, IFN-γ, and YY1. Representative histograms (C) and aggregate data (D), show the production of IFN-γ (left) and IL-4 (right) by WT NKT cells, YY1+ cKO NKT cells, and YY1− cKO NKT cells following in vitro activation. (E) NKT cells were FACs sorted from WT, PLZF KO, and YY1 cKO mice. RNA was prepared and cDNA was generated. qPCR was used to measure the presence of IL-4 and IFN-γ mRNA in the sorted NKT cell populations. Data are representative of 4 (B, E) or 3 (D) independent experiments and biological replicates. The horizontal lines indicate the mean (±s.e.m.). *P<0.05 **P<0.01, ***P<.001 determined by one-way ANOVA (B, D, E).

