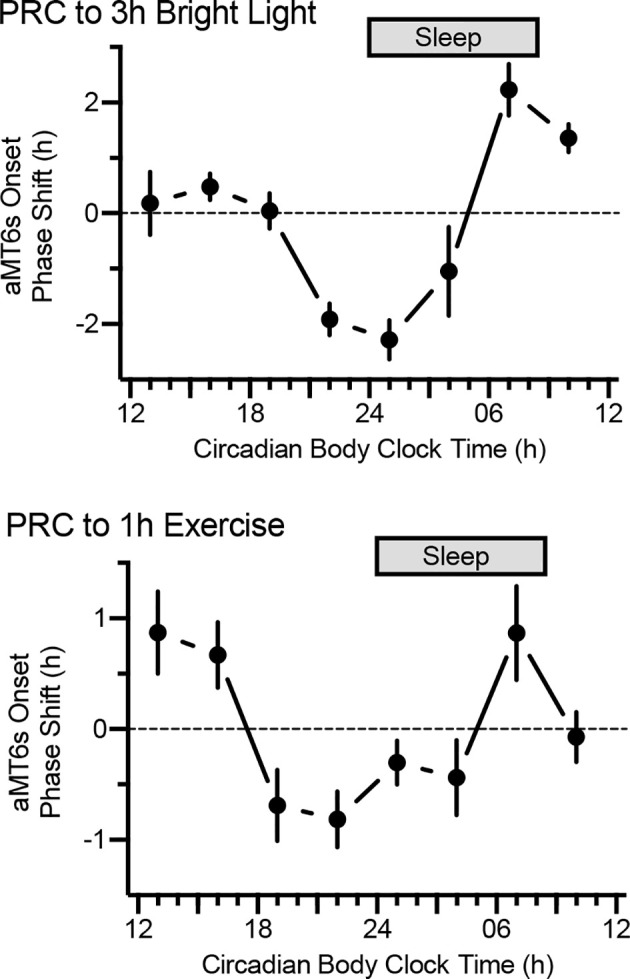
Figure 3.

Phase-response curves to bright light (n = 105, top) and exercise (n = 101, bottom). By convention, phase advances and phase delays are denoted by positive and negative values on the ordinate, respectively. Participants followed the ultrashort sleep-wake schedule for 5.5 days, receiving light (3 h, 5,000 lux) or exercise (1 h, moderate) on 3 consecutive days. Shifts in aMT6 onset from baseline to end-of-study (y axes) depended on timing of the stimuli. Note: maximal phase delays for light and exercise occurred at 0100 h and 2200 h circadian body clock time, respectively.
