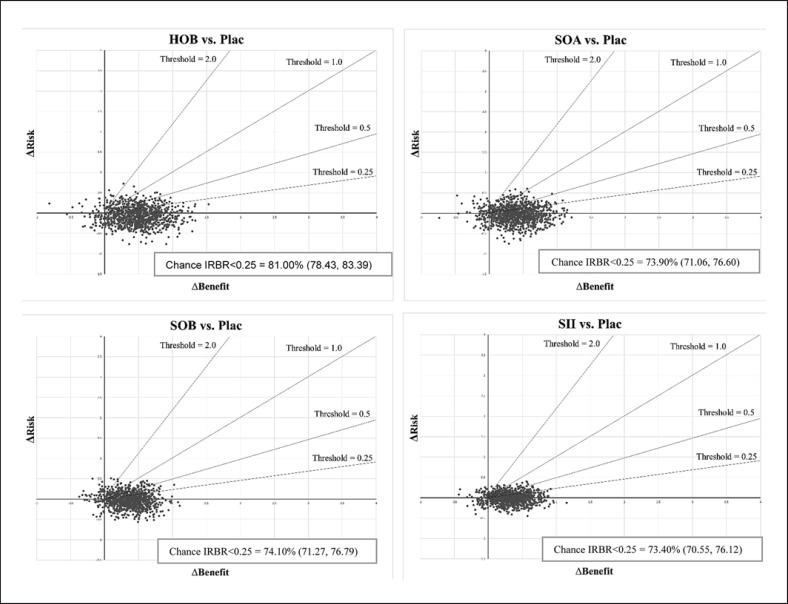
Fig. 4.
The risk-benefit acceptability planes of HOB, SOA, SOB, and SII compared with placebo. The horizontal bar represents the 95% CI for the difference in benefits of PDA closure, and the vertical bar is the 95% CI for the difference in the probability of the composite risk outcomes. The ● marks the point estimate of the risk-benefit ratio. Dashed lines are the risk-benefit acceptability threshold of 0.25, 0.5, 0.75, 1.0, and 2.0.

