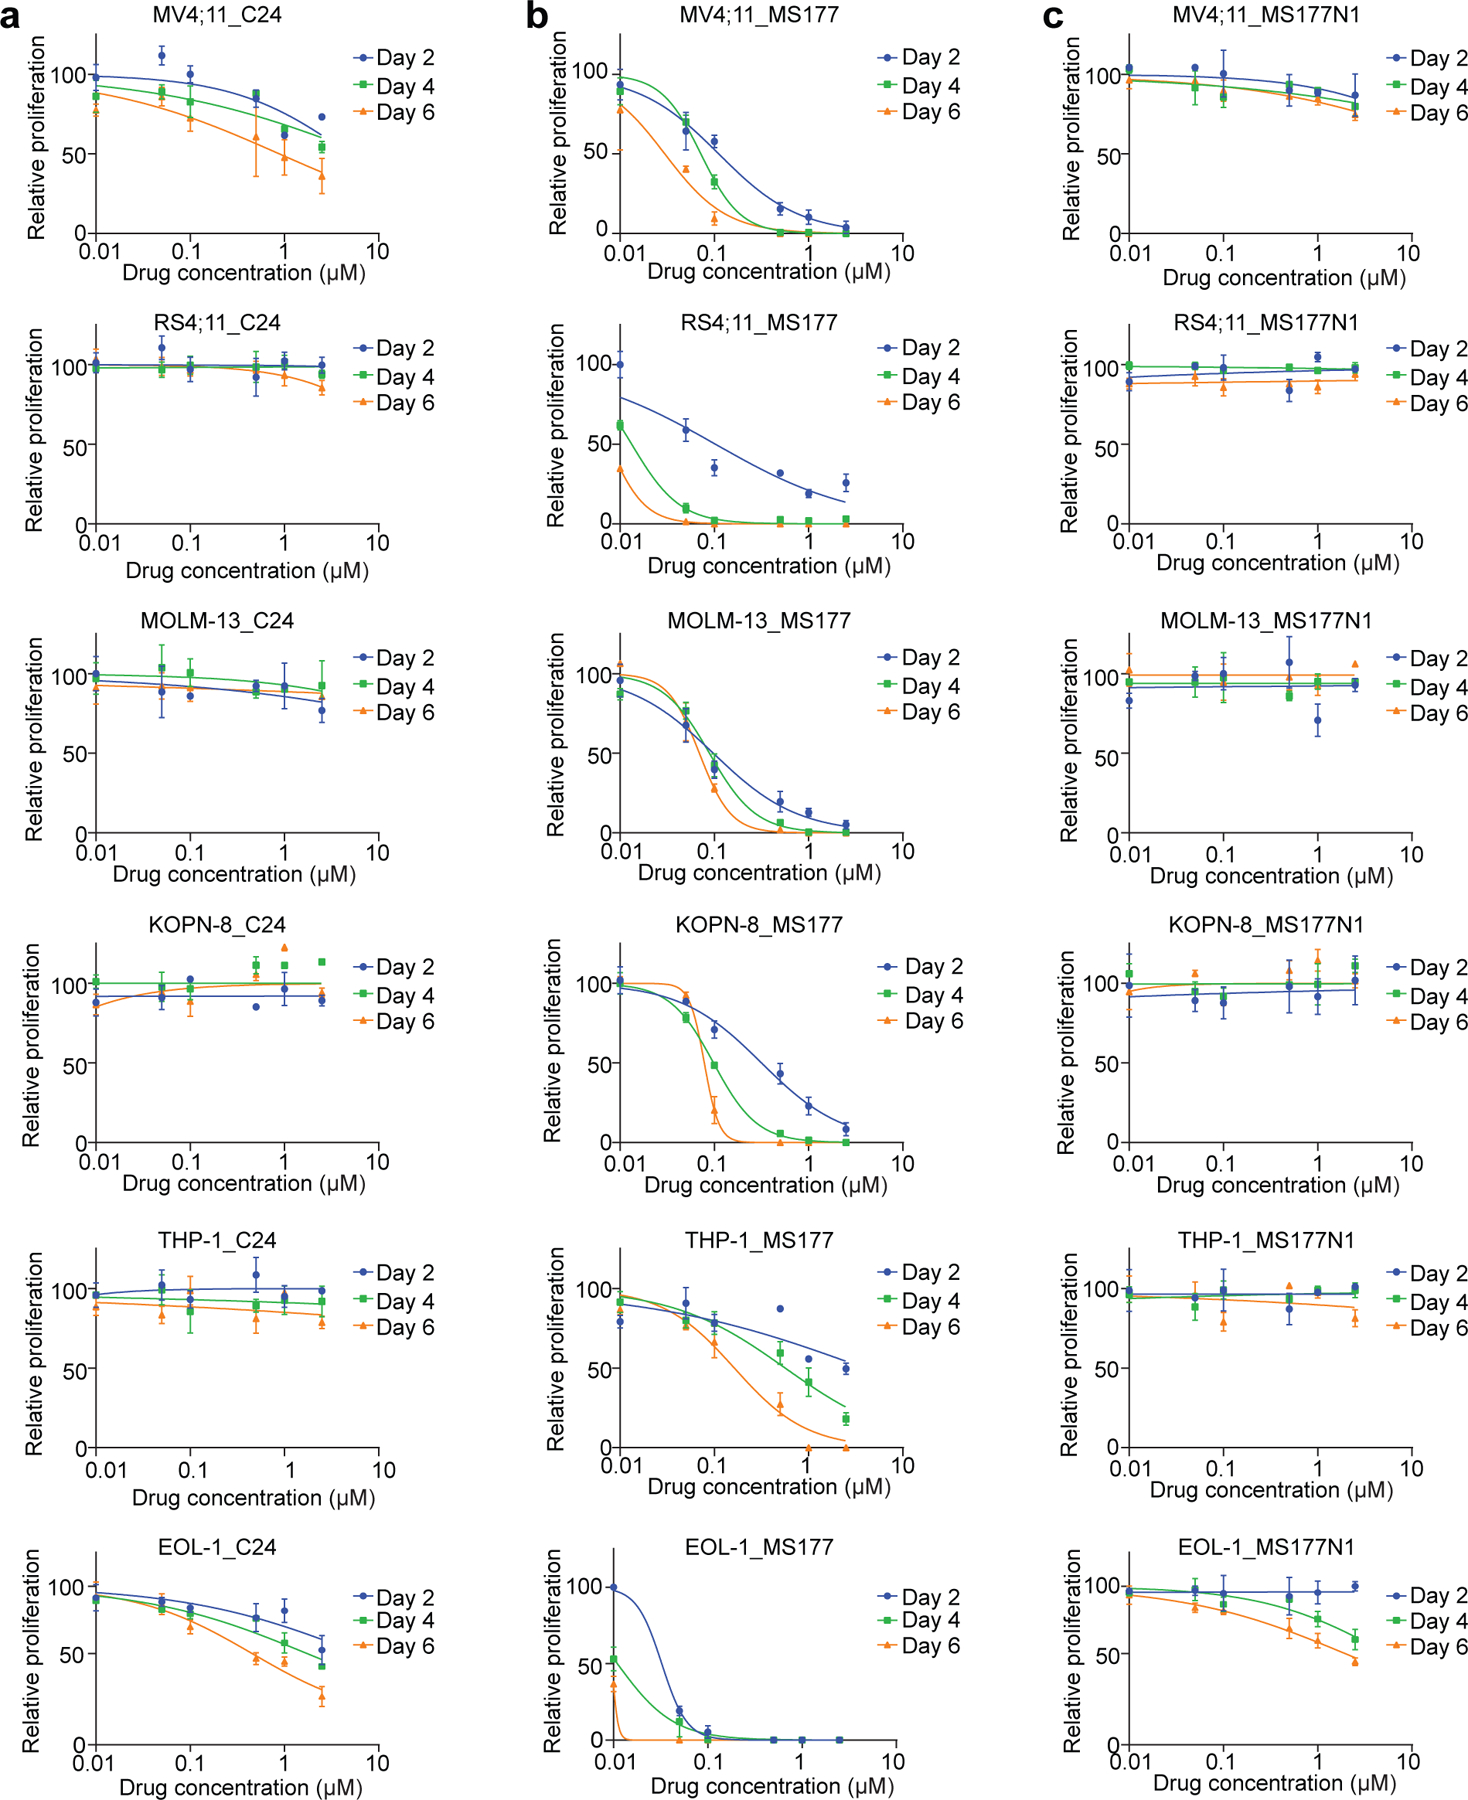
Extended Data Fig. 4|. Compared to C24 or MS177N1, MS177 is much more potent in inhibiting tumor cell growth.

(a-c) Plots showing the growth inhibitory effect of various used concentrations (x-axis; in the log10 converted values) of either C24 (a), MS177 (b) or MS177N1 (c) using a panel of six MLL-r acute leukemia cell lines (i.e., MV4;11, RS4;11, MOLM-13, KOPN-8, THP-1 and EOL-1 cells), treated for 2, 4 or 6 days. Y-axis shows relative cell growth after normalization to DMSO-treated controls (n=3; mean ± SD).
