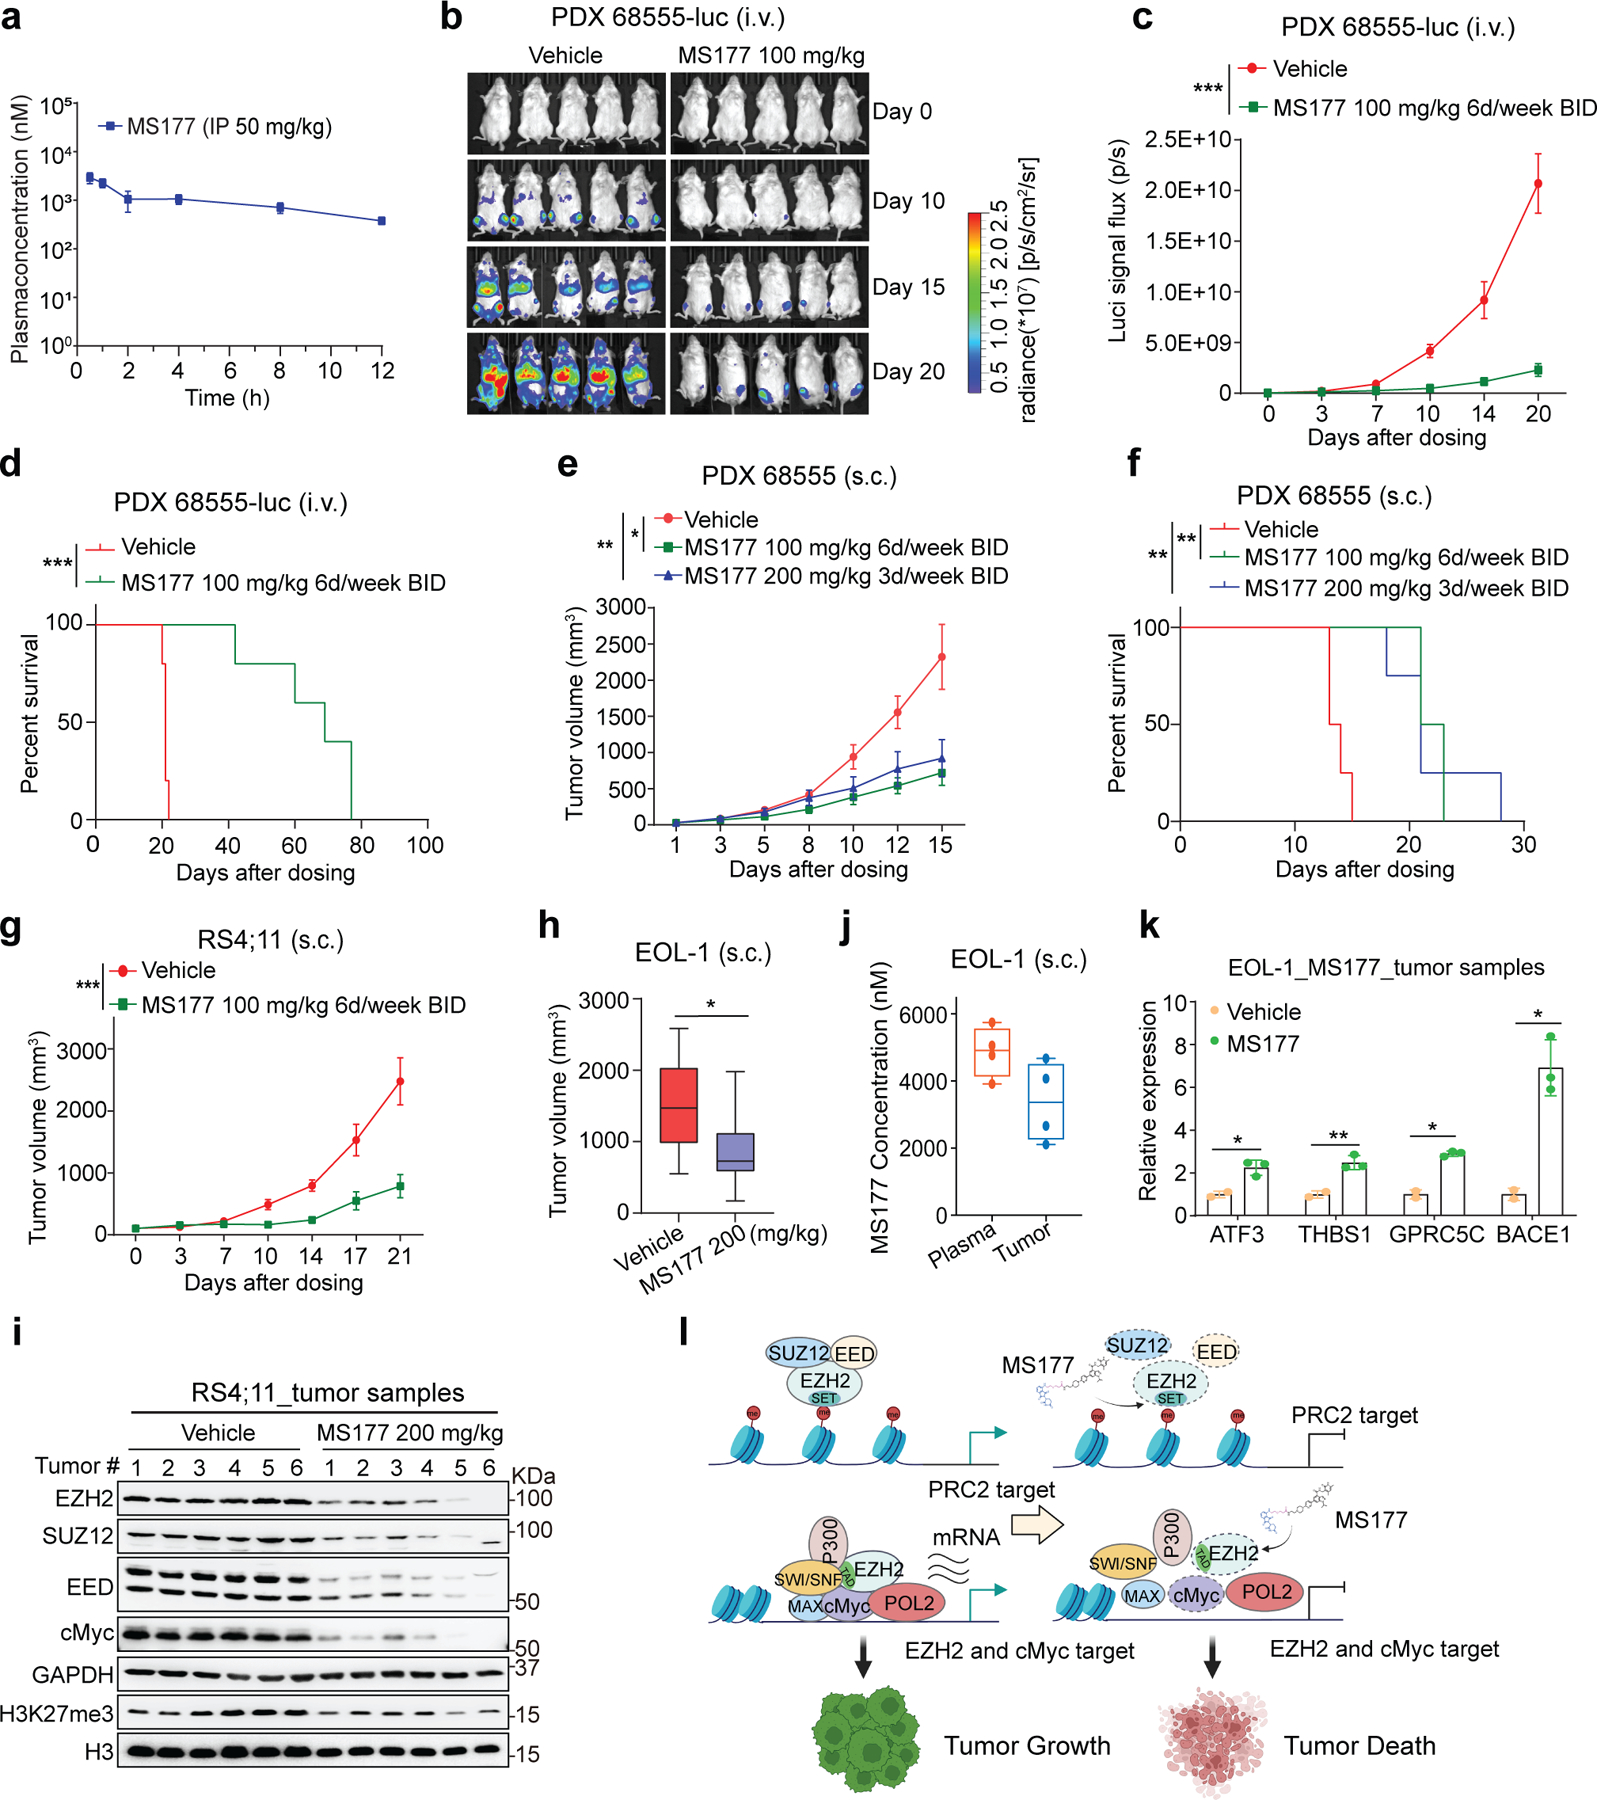
Fig. 8|. MS177 represses AML growth in vivo.

a, Intra-plasma concentrations of MS177 over a 12-hour period after a single indicated intraperitoneal (i.p.) injection into male Swiss Albino mice (n = 6; mean ± SEM from three mice per time point).
b-d, Bioluminescent imaging (b) and signal levels (c) and Kaplan-Meier curve (d) of NSG-SGM3 mice transplanted intravenously (i.v.) with the luciferase (luc)-labeled MLL-r AML PDX cells, which were then treated with vehicle or the indicated MS177 dosing (n = 5 mice per group; mean ± SD). Statistical significance was determined by two-way ANOVA (c) or log-rank (Mantel-cox, d) test.
e-f, Averaged tumor volume (e, g-h) and Kaplan-Meier curve (f) of mice subcutaneously (s.c.) transplanted with MLL-r AML PDX (e-f), RS4;11 (g) or EOL-1 cells (h), which were then treated with vehicle or the indicated MS177 dosing (n = 5 per group; mean ± SD). Statistical significance was determined by two-way ANOVA (e), log-rank test (f) or unpaired two tailed student’s t-test (h; boxplot shows mean and interquartile range).
i, Immunoblotting for the indicated protein using the collected RS4;11 s.c. xenografted tumors, freshly isolated from NSG mice that were treated with vehicle or the indicated MS177 dosing for 5 days.
j, Intra-plasma and intra-tumor concentration of MS177 in NSG mice in h, treated with vehicle or the indicated MS177 dosing (n = 4 per group). Dots represent individual tumors.
k, RT-qPCR for the EZH2-repressed target in the EOL-1 s.c. xenografted tumors as isolated in i. Y-axis shows mean ± SD after normalization to GAPDH and then to vehicle-treated (n = 3; unpaired two-tailed Student’s t-test).
l, A model that, in MLL-r leukaemias, EZH2 forms canonical (EZH2:PRC2) and noncanonical (EZH2:cMyc:coactivators) interactions for promoting target gene repression and activation, respectively, both of which mediate oncogenesis (top). These oncogenic actions of EZH2 can be suppressed by the EZH2 PROTAC degrader, MS177 (bottom).
*, **, and *** denote the P value of < 0.05, 0.01 and 0.005, respectively. NS denotes not significant. Numerical source data, statistics, exact P values and unprocessed blots are available as source data.
