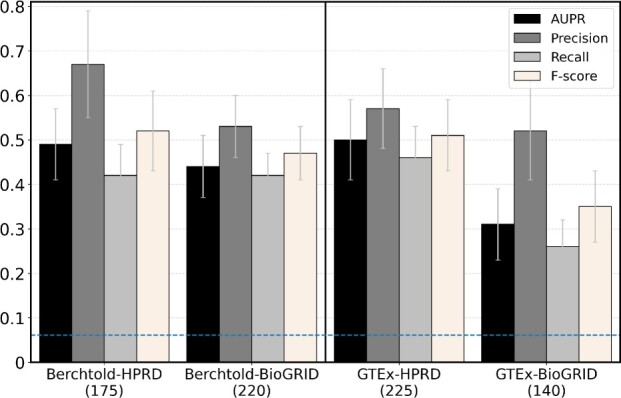
Fig. 2.

The prediction accuracy in terms of AUPR, precision, recall and F-score of the four weighted dynamic aging-specific subnetworks, each under its best predictive model. The number below each subnetwork name represents the number of genes that are predicted as aging-related by the corresponding subnetwork. The horizontally dashed line indicates the prediction accuracy scores expected by chance, i.e. the fraction of all genes in the ground truth data that are labeled as aging-related
