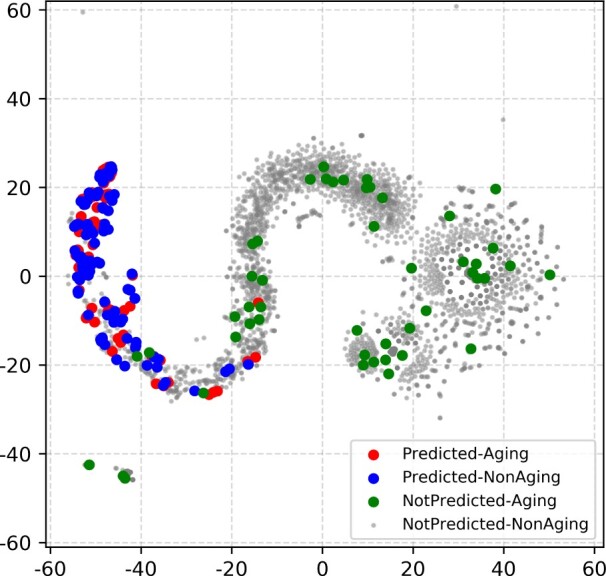
Fig. 5.

Illustration of topological (dis)similarities between Predicted–Aging, Predicted–NonAging, NotPredicted–Aging and NotPredicted–NonAging genes in a given subnetwork by embedding their features into 2D space. This figure is for Berchtold-BioGRID; similar embedding trends hold for the other three subnetworks (Supplementary Figs S8, S10 and S11). This is a zoomed-in visualization with outliers removed for simplicity (see Supplementary Fig. S9 for the full visualization). When mapping features into 2D space, we have tested tSNE and PCA and selected the visualization with the clearest pattern. This figure is generated using tSNE
