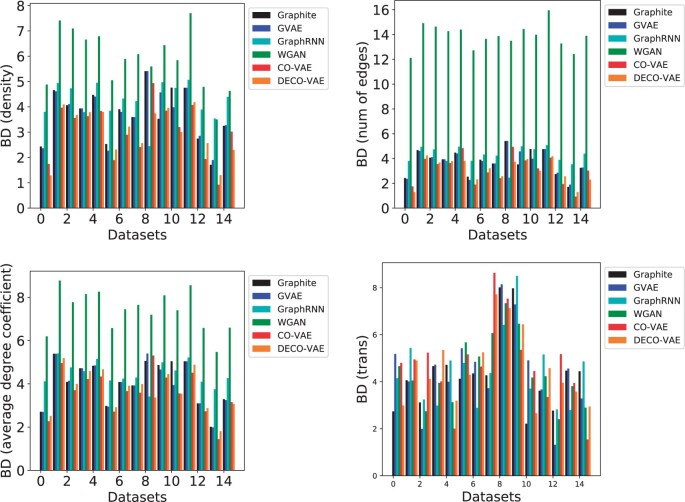
Fig. 3.
The generated graphs are compared to the ones in the training dataset on four graph properties. BD is used to measure the distance between two distributions. The boxplots show the range of BD values over all compared models across all datasets. Annotations denote the values obtained by CO-VAE and DECO-VAE

