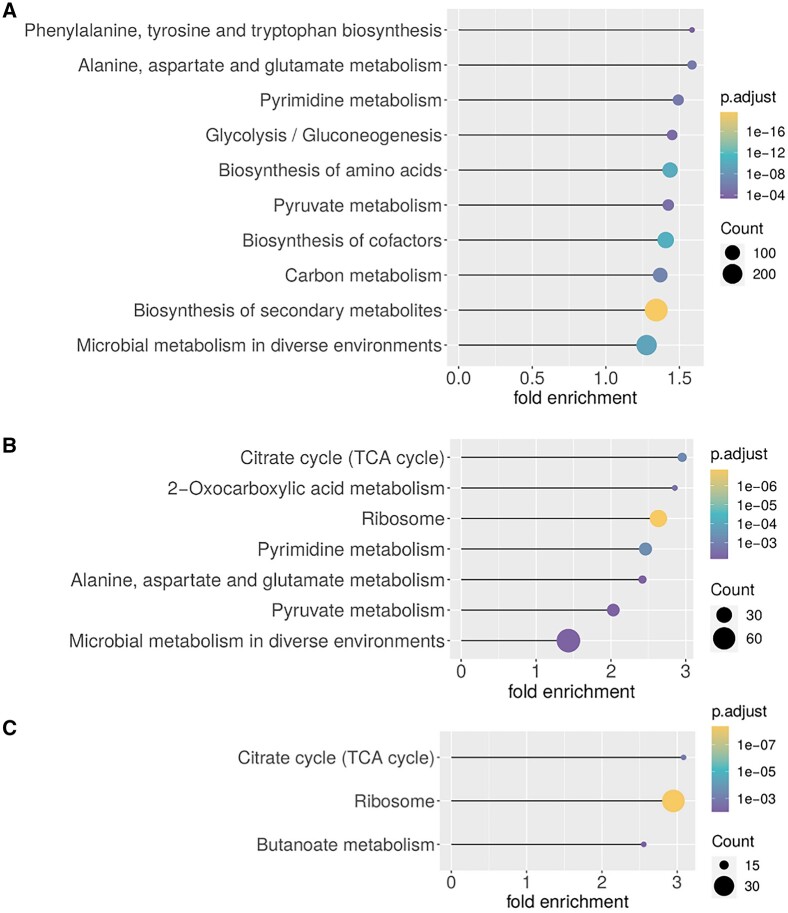
Fig. 10.
KEGG annotation enrichment analysis of proteins in the E.coli network using the R-package clusterProfiler. Shown are up to 10 KEGG-categories with p.adjust < 0.01, ordered by fold-enrichment. Control for multiple testing via the Benjamini–Hochberg method (default in clusterProfiler). (A) Enriched KEGG pathways for all proteins of the input network, (B) for proteins, which are in bicliques up to c/p-biclique size of c = 5 and p = 2 (size with highest F1-score) and (C) for proteins of predicted interactions applying the same maximum c/p-biclique size. For a complete table, see Supplementary Tables S11–S13

