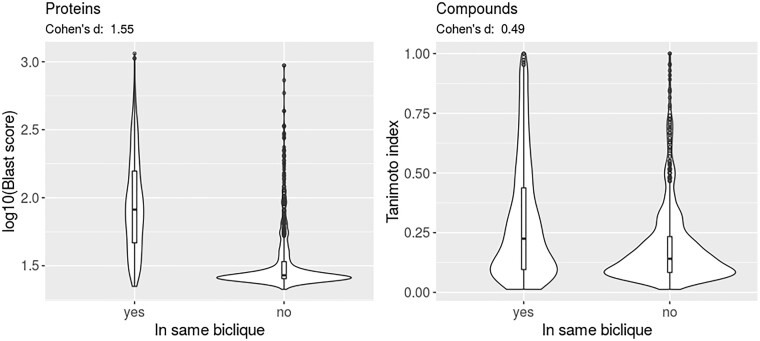
Fig. 5.
Molecular similarity of compounds and proteins within the same and between different bicliques. Violin plots of molecular similarity measures (blastp-score for proteins, Tanimoto index for compounds, see Section 2) of compounds and proteins that are part of the same biclique or not with Cohen’s d effect sizes indicated, respectively. Distributions are based on 1000 randomly selected within and across-different molecule pairs. Corresponding Wilcoxon rank sum test P-values: compounds: <2.2E-16, proteins: <2.2E-16

