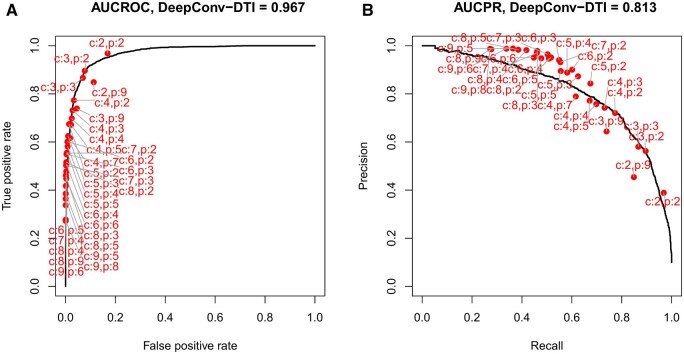
Fig. 9.
Performance comparison of BiPredict (red circles) and DeepConv-DTI (black solid line) on human test data. (A) TPR-FPR ROC and (B) precision-recall curve. Labels indicate c/p-biclique size. Note that for BiPredict, no continuous, sortable score variable is produced. Thus, neither a curve nor an associated area can be computed. ROC-curve created using the R-package ROCR (Sing et al., 2005). Areas computed numerically (trapezoid approximation). Label placing by R-package basicPlotteR (Crispell, 2021)

