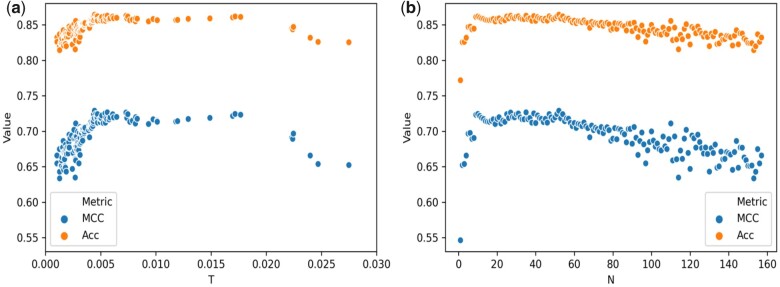
Fig. 4.
Scatter plot of the accuracy (Acc) and the MCC for the RF classifier trained on the Bal-BM4 and tested on the Bal-BM5up for the forward feature selection. ‘I’ stands for the features importance, while ‘N’ is the number of features added. (a) The plot shows the change for the two metrics upon adding features with importance ranging from 0 to 0.03. Both accuracy (Acc) and the MCC reach a plateau in the performance after an importance of 0.01. (b) The plot shows the change for the two metrics when adding sequentially an increasing number (N) of different features from the highest to the lowest importance. After adding 10 to 20 features (corresponding to an importance of ) the two metrics are maximized, reach a plateau and then, after features are added, slowly decrease

