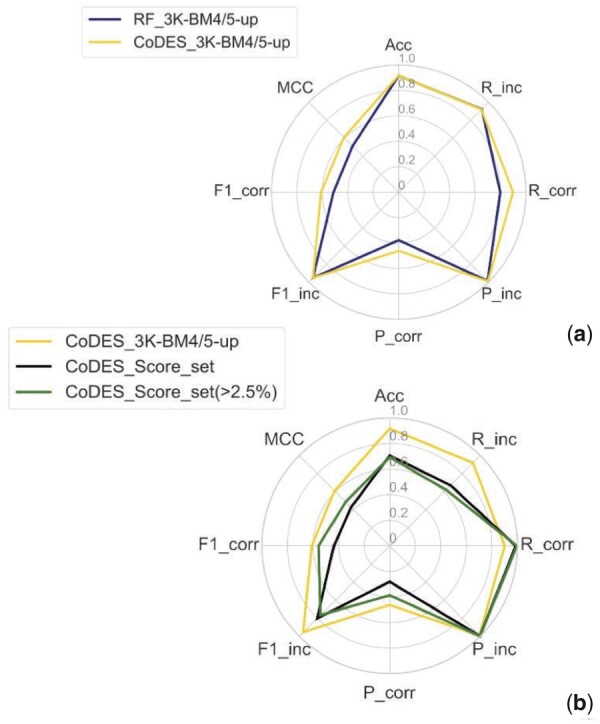
Fig. 5.

Performance of CoDES on unbalanced datasets. (a) Radar plot of the performance metrics for CODES on the unbalanced validation set (BM5 update, golden line). For the sake of comparison, the original RF classifier performance according to the BM4/BM5-update approach is also reported (the solid dark line is the same shown in Figs 2–3). (b) Radar plots of the performance metrics for CoDES on the complete unbalanced Score_set (black line) and on the Score_set targets with over 2.5% of correct models (green line)
