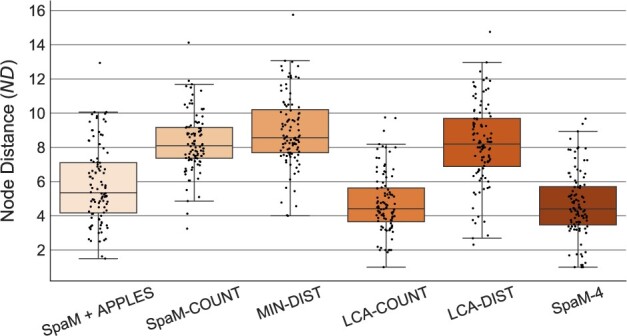
Fig. 2.

Average ND over n = 100 pruning experiments on the bac-150 dataset. ND was measured with PEWO for the five different versions of App-SpaM and the combination of SpaM and APPLES. A single pattern with weight w = 12 and 32 don’t care positions is used for all heuristics. Every box plot shows the overall distribution over all 100 pruning experiments (black dots).
