
Fig. 2.
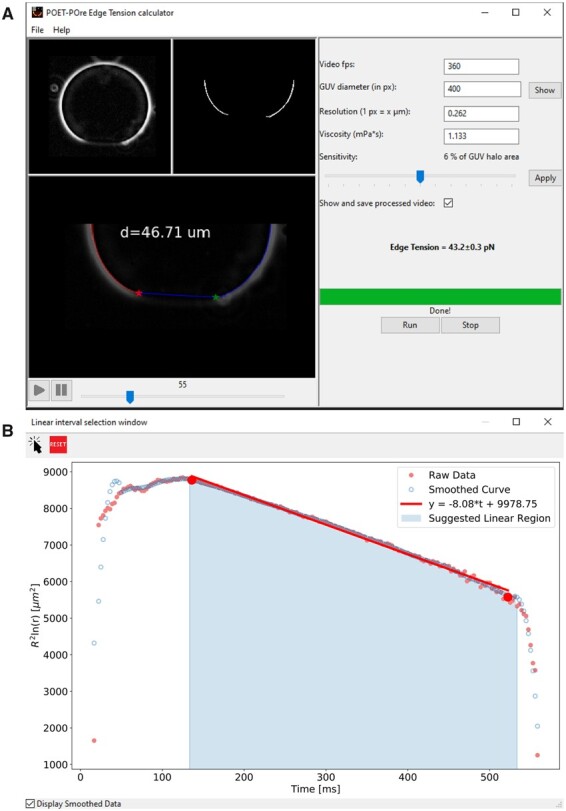
GUI of PoET. (A) Main window exhibiting a processed video in the bottom panel. (B) Pore dynamics graph of the raw (dark pink solid circles) and smoothed data (blue open circles), suggested linear region (light blue area) and a linear fit (red line) to the slow pore closure stage used for pore edge tension calculation.