Fig. 3.
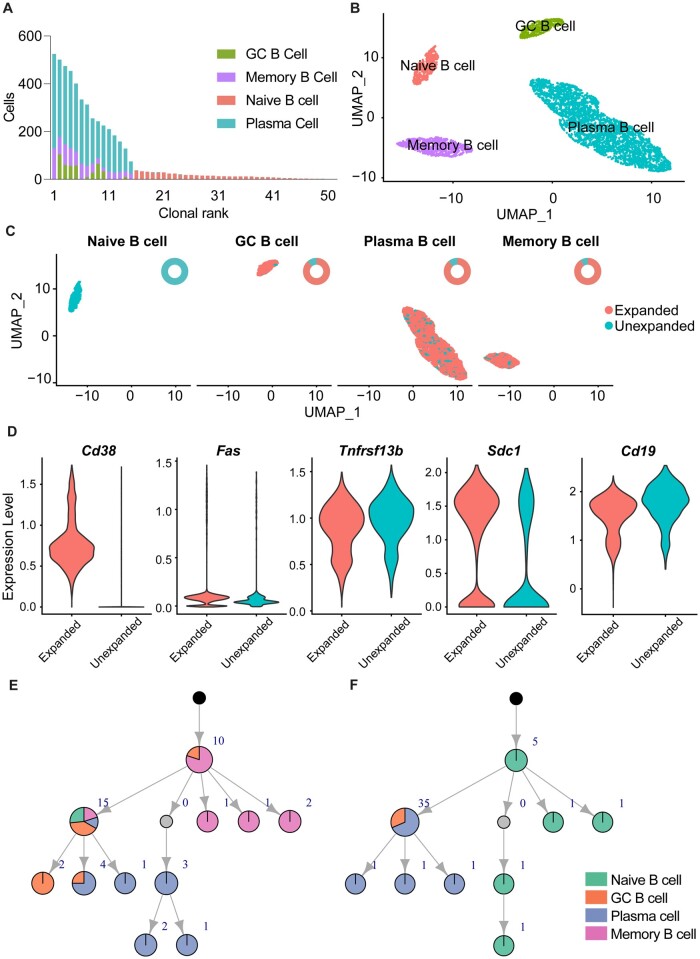
Echidna integrates gene expression and immune receptor during single-cell simulation. (A) Preferential expansion of B cell subsets based on cell phenotype. Color corresponds to the number of cells within a given clone of a certain phenotype. Clone is defined as all cells belonging to a single simulated V(D)J recombination event. (B) Uniform manifold approximation projection (UMAP) highlighting distinct transcriptional profiles of naive, germinal center (GC), memory and plasma cells. (C) UMAP highlighting expanded and unexpanded clones. Expanded clones are defined as those clones supported by two or more unique cells. The donut plots on the up-right corner indicate the proportion of expanded and non-expanded cells in each phenotype. (D) Normalized expression of Cd38,Fas,Taci,Cd138 and Cd19 separated by expanded versus unexpanded cells. (E) Simulated clonal lineage depicting that certain B cell subtypes can be customized to preferentially undergo somatic hypermutation or clonal expansion.

