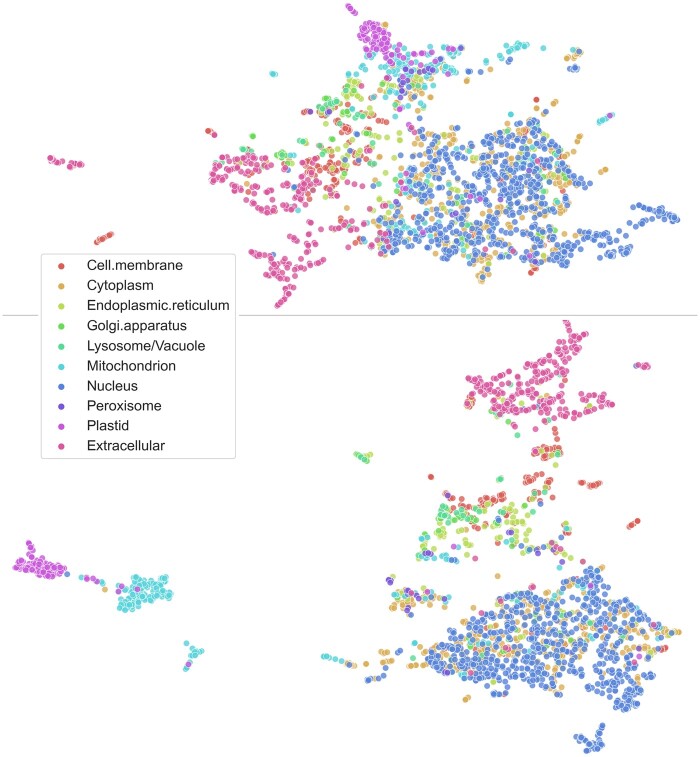
Fig. 4.
Qualitative analysis confirmed LA to be effective. UMAP (McInnes et al., 2018) projections of per-protein embeddings colored according to subcellular location (setDeepLoc). Both plots were created with the same default values of the python umap-learn library. Top: ProtT5 embeddings (LA input; x) mean-pooled over protein length (as for FNN/EAT input). Bottom: ProtT5 embeddings (LA input; x) weighted according to the attention distribution produced by LA (this is not as we sum the input features x and not the values v after the convolution)

