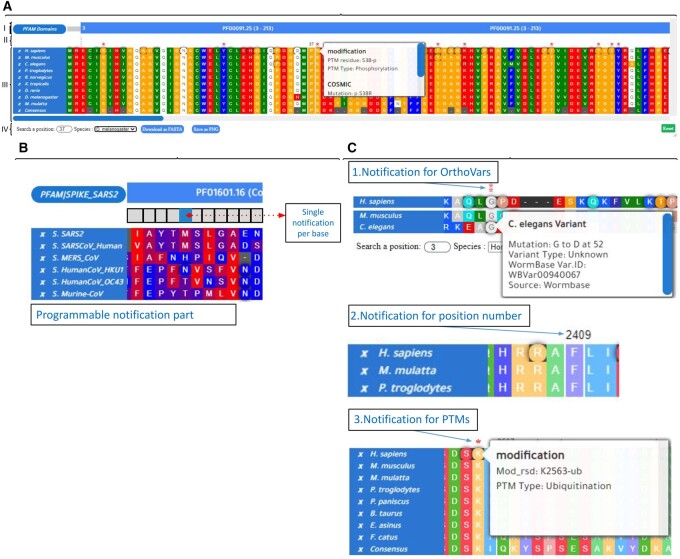
Fig. 1.
An overview of the MSABrowser tool. MSA for homologous proteins of the human TUBA1A is depicted in this figure, along with genetic variations on the corresponding positions on sequences and associated intervals such as protein domains. (A) (I) The annotation part represents the specified intervals for the sequence and in this example, it is used for illustrating the positions of the protein domains with cross-link features that enable users to locate the website or page of the original database or article. (II) The notification part shows any type of defined modifications as a red asterisk above the sequence per position and displays the searched position in a species above the alignments. (III) The sequence alignment part contains the imported alignment data with the previously selected colour scheme. Also, rounded (circle) positions indicate that at least one genetic variation or modification exists in this position. A rectangular white background pop-up box appears when the mouse hovers the specific position in the sequence and the genetic variations and modifications are listed in this pop-up box. On the bottom, an auto-generated ‘Consensus’ sequence is displayed. On the left side, species names contain cross-reference links for referring to the dedicated page of the sequence according to its protein identifier such as a UniProt number and the near-white ‘x’ button enables users to hide the sequence from the alignment together with its identifier. (IV) A position in the sequence of any species listed in the alignment can be searched and the sequence alignment data in FASTA format can be downloaded with the blue button and visualization of alignment data can be exported as PNG format. Also, with the green ‘Reset’ button, it is available to reload the viewer. (B) Visualization of MSAs of six virus spike proteins with the MSABrowser tool. The positions with the annotations are marked in a circle, while the positions without annotations are displayed in a square. The full MSA comparisons with annotations can be found at our dedicated GitHub site https://thekaplanlab.github.io/ (C) Shown is the display of orthologous variants (OrthoVars), the positions of amino acid position or nucleotide, or PTMs with the programmable notification part of MSABrowser

