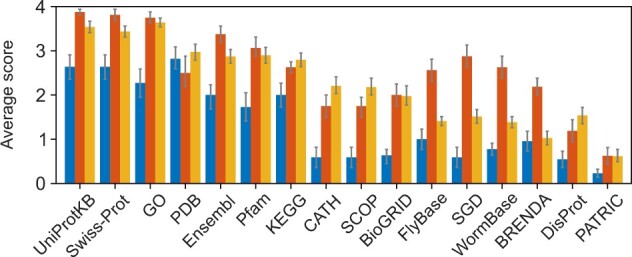
Fig. 3.

Familiarity with major databases. Each bar represents an average score for a core group indicating the familiarity with databases, where 0 = ‘not familiar’, 1 = ‘heard of it’; 2 = ‘use rarely’; 3 = ‘use sometimes’; 4 = ‘use frequently’. Blue, red and yellow bars show the average scores from experimentalists, biocurators and computational biologists, respectively
