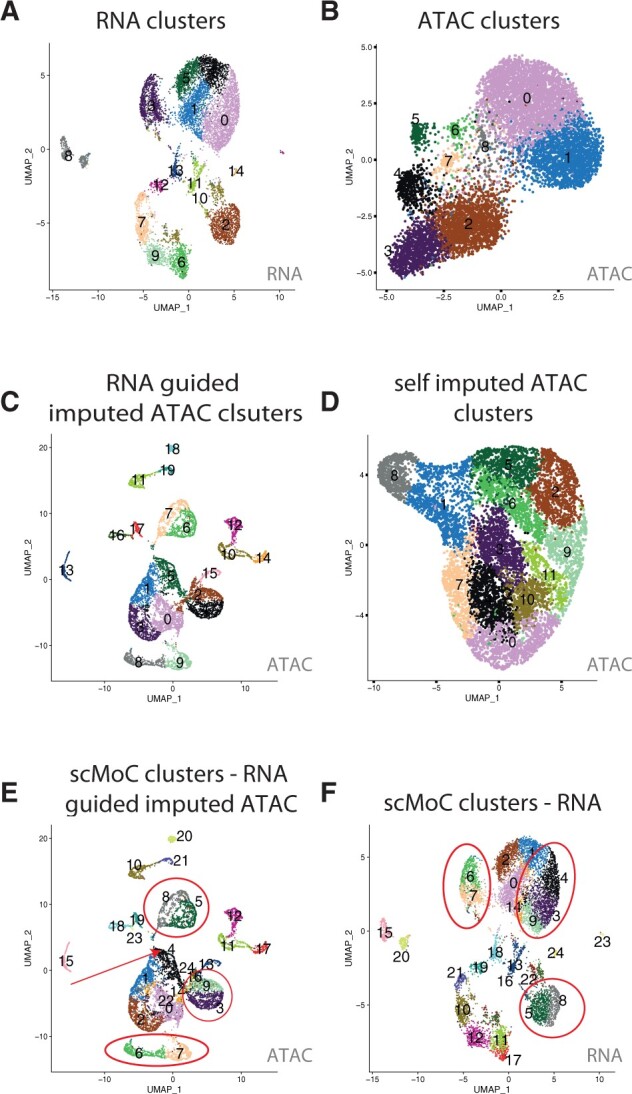
Fig. 2.

scMoC shows different cluster in the scRNA-seq data based on the imputed scATAC-seq data. UMAP visualizations of the sci-CAR. (A) scRNA-seq data, colors indicating RNA-based clusters. (B) scATAC-seq data, colors indicating ATAC-based clusters. (C) RNA-guided imputed scATAC-seq data, colors indicating clusters within the imputed data. (D) Self-imputed scATAC-seq data, colors indicating clusters detected in these data. (E) RNA-guided imputed scATAC-seq data using the scMoC clusters. (F) scRNA-seq data using the scMoC clusters. Clusters in both E and F are named and colored identically according to scMoC clusters
