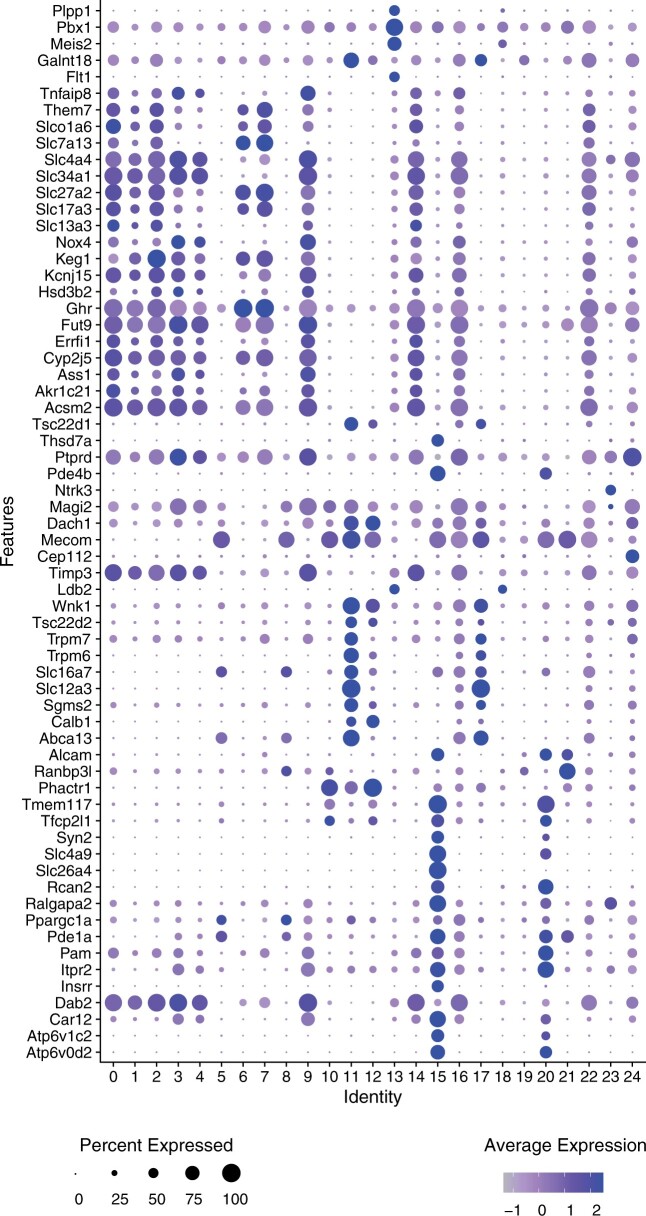
Fig. 3.
scMoC clusters marker genes. Dot plot showing the DE genes (i.e. markers) of the scMoC clusters. Expression of a set of Mouse kidney marker genes across scMoC clusters. The color intensity of the dot represents the average expression of the gene across the cells in the cluster and the size relates to the percentage of cells within the cluster expressing each gene

