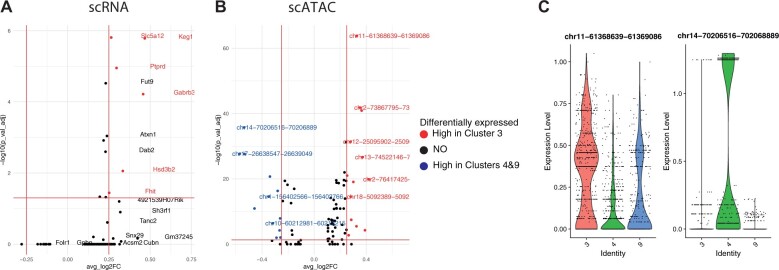
Fig. 4.
DE genes and differentially accessible peaks for ATAC induced splits. Volcano plots showing (A) DE scRNA genes, and (B) differentially accessible scATAC peaks between scMoC cluster 3 versus scMoC clusters 4&9. (C) Violin plot for the top upregulated peak (i.e. chr11-61368639-61369086) and top downregulated peak (i.e. chr14-70206516-70206889)

