
Figure 3: Concentration-response modeling of phenotypic profiling data following berberine chloride treatment in six human-derived cell lines.
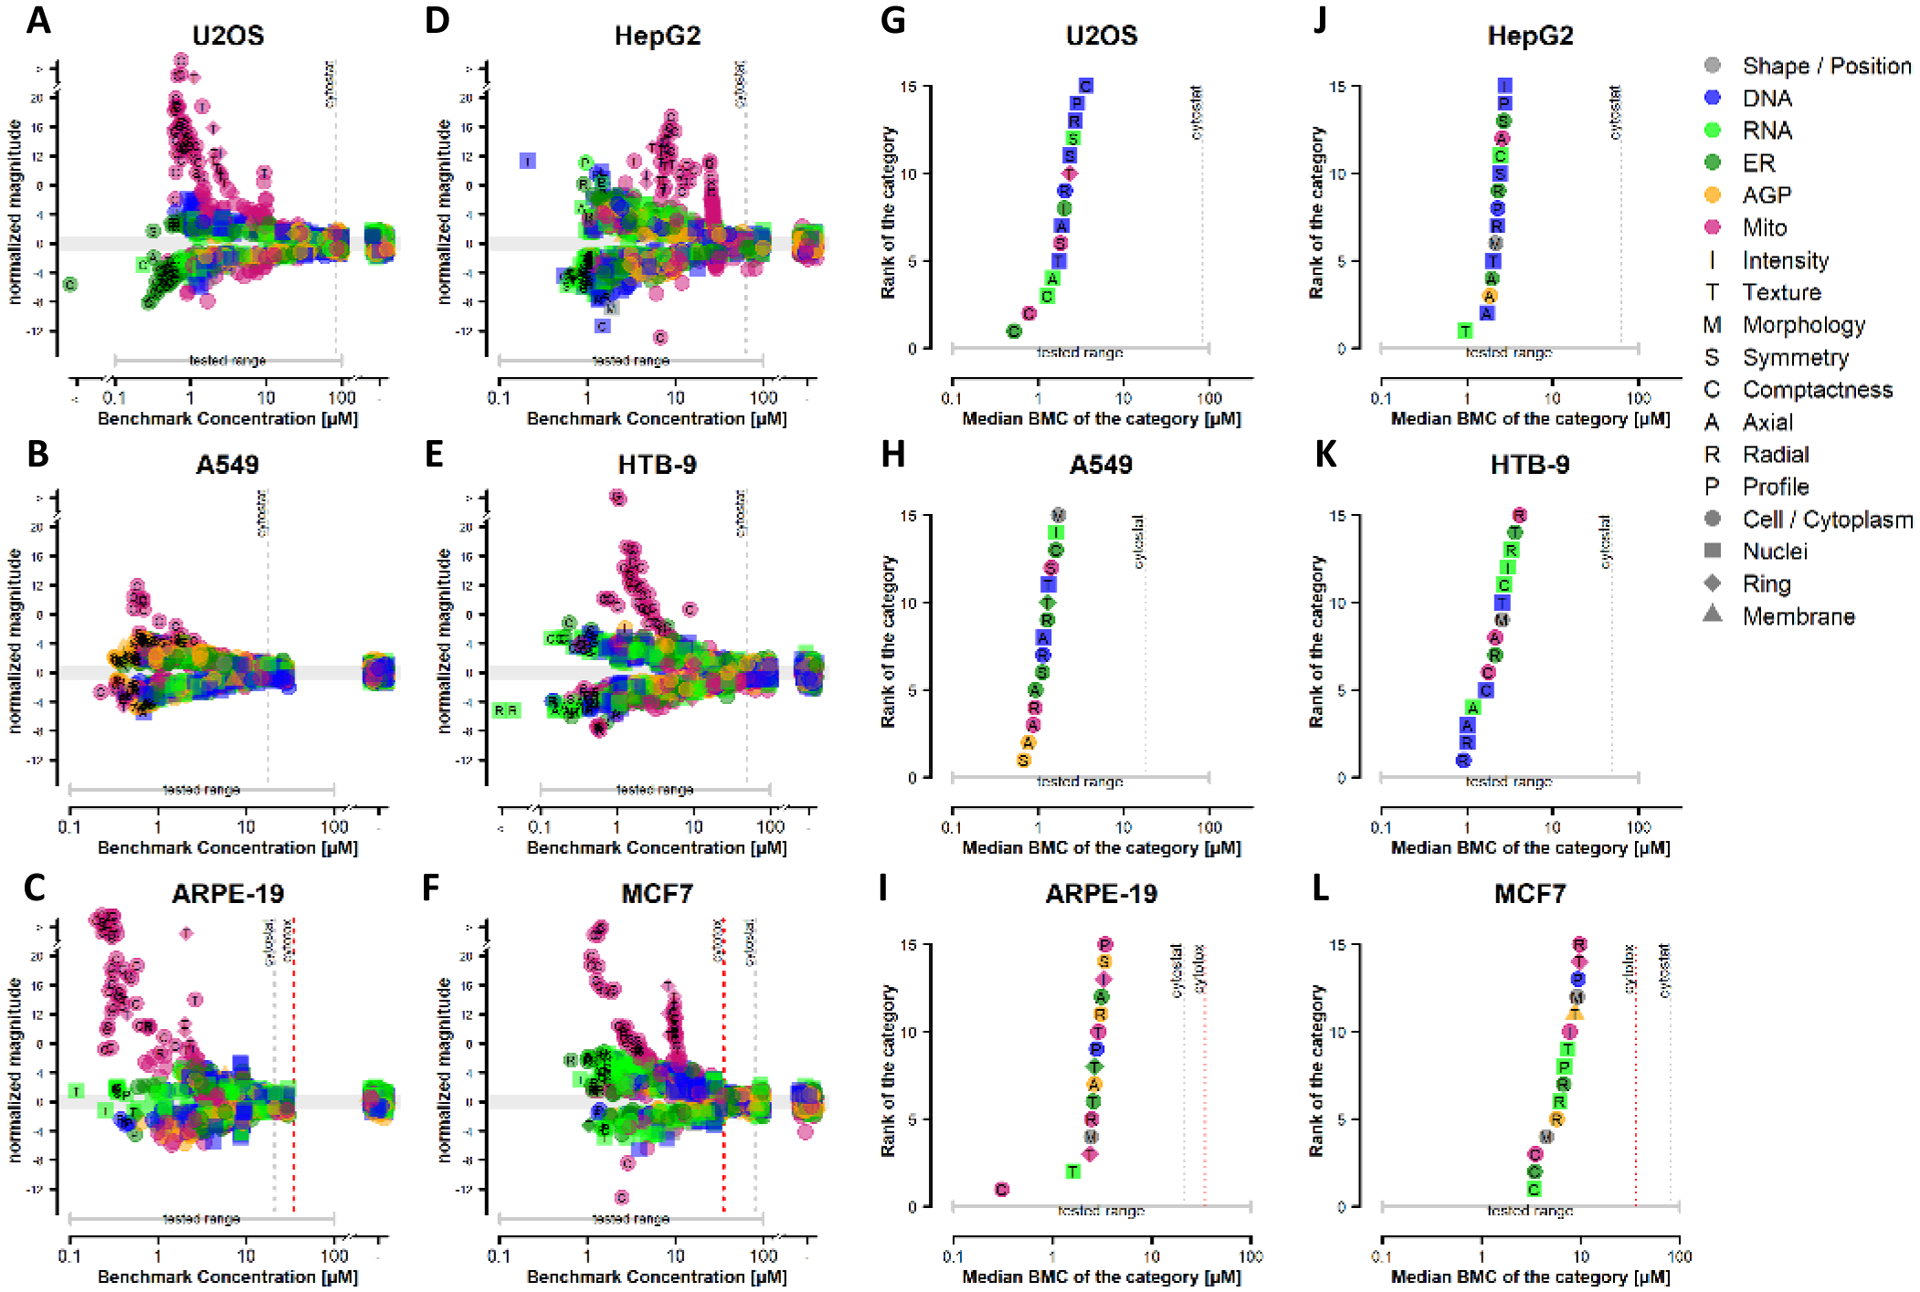
(A-F) Potency-magnitude plots corresponding to an individual cell line treated with berberine chloride. Each point on the potency-magnitude plots refers to a phenotypic feature represented by the BMC on the x-axis and the normalized effect magnitude on the y-axis. Features are coded by fluorescent channel (color), compartment (shape) and feature type (letter). The gray shaded area in the potency-magnitude plots shows −1 < magnitude < 1 and represents the threshold for a marked response from DMSO control. (G-L) Accumulation plots corresponding to an individual cell line treated with berberine chloride. Feature-level BMCs were grouped into 49 categories. Categories where ≥30% of the constituent features were concentration-responsive were ranked in ascending order according to the median BMC of the category. The 15 most sensitive categories for each cell line are displayed and coded as described in panels A-F. The median feature-level BMC for each category is represented on the x-axis and the category rank represented on the y-axis. In all panels, the onset of cytotoxicity and cytostatic effects are marked by red and grey vertical dotted lines, respectively. Absence of vertical lines indicates that cytotoxicity or cytostatic effects were not observed within the concentration range tested.