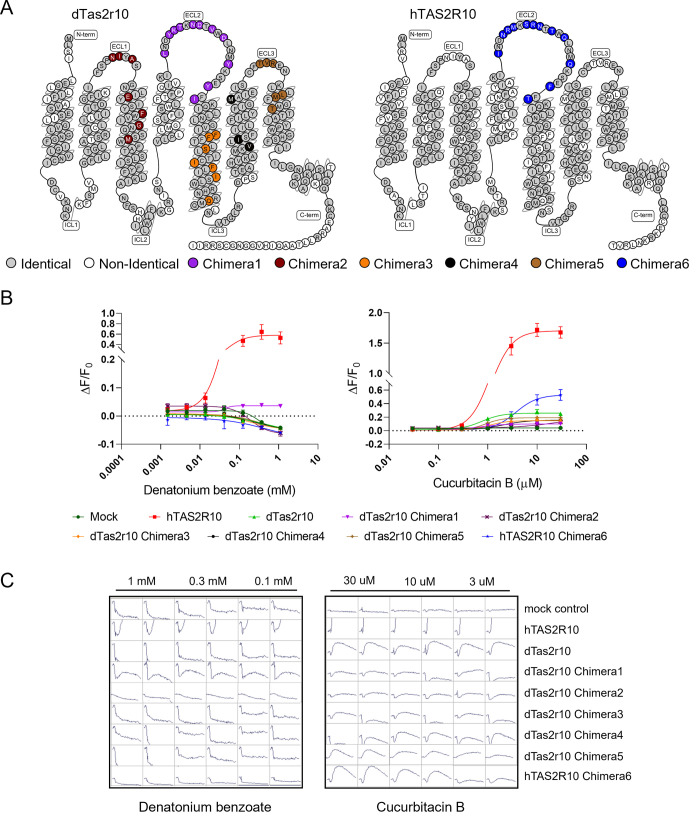
Fig 2. Calcium imaging analysis of chimeric receptors.
A) Chimeras 1–5 were created with a dog Tas2r10 backbone and non-identical amino acids from different domains of hTAS2R10. Chimera6 consisted of the human hTAS2R10 backbone with the non-identical amino acids from dog Tas2r10 ECL2. B) Only native hTAS2R10 and dTas2r10 Chimera1, which contained the hTAS2R10 ECL2, responded to DB. Chimera6 (human TAS2R10 with dog ECL2) lost all sensitivity to DB. All chimeric receptors retained their sensitivity to cucurbitacin B, although the response of Chimera6 was reduced compared to native hTAS2R10. DB and cucurbitacin B concentrations are plotted on a log scale on the x-axis, the y-axis shows the maximum change in fluorescence divided by the baseline fluorescence before compound injection (ΔF/F0). Colour scheme is common between panel A and panel B. C) Raw data is shown for all receptors with both DB and cucurbitacin B at the top three concentrations tested. Scale on the y-axis is -1000 to 2000 RFU with 70 seconds on the x-axis for all traces.

