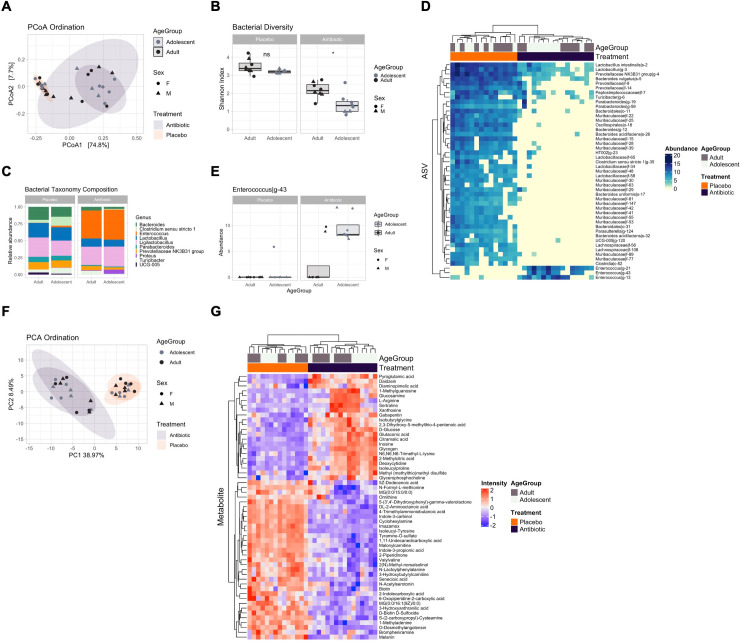
Fig 4. Short-term impact of antibiotics on adolescent and adult microbial and metabolomic profiles.
(A) Principal coordinate analysis (PCoA) showing bacterial ordination by age group and treatment at day 17. (B) Bacterial Shannon diversity boxplots, and (C) Taxonomy composition barplots, comparing treatment and age groups at day 17. (D) Heatmap of differentially abundant ASVs between treatment groups at day 17. (E) Boxplot, of differentially abundant ASVs between treatment and age groups at day 17. (F) Principal component analysis (PCA) showing metabolomic ordination by age group and treatment at day 17. (G) Heatmap of differentially abundant metabolites between treatment groups at day 17. Boxplots are indicative of median, interquartile range (IQR) (boxes) and 1.5x IQR (whiskers). *, p < 0.05; n.s., not significant.

