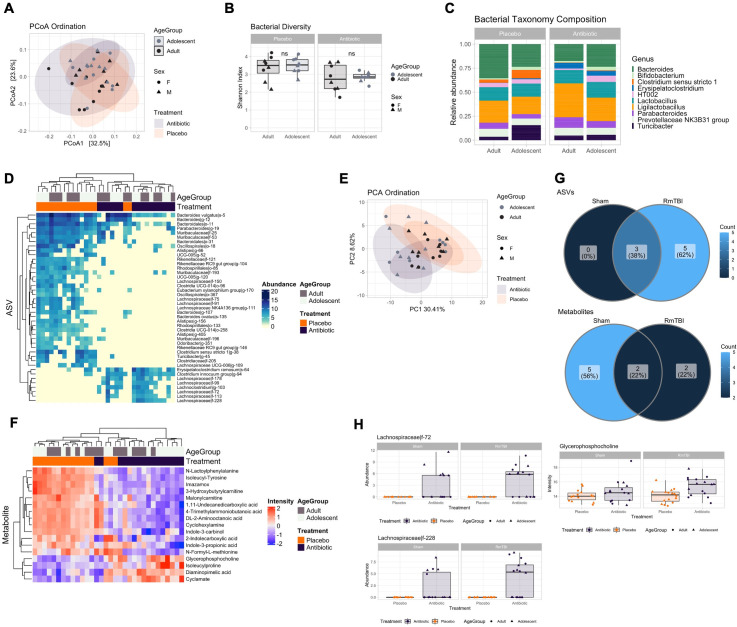
Fig 8. Comparison of antibiotic and placebo RmTBI adolescent and adult microbial and metabolomic profiles.
(A) Principal coordinate analysis (PCoA) showing bacterial ordination by age group and treatment at day 30. (B) Bacterial Shannon diversity boxplots, and (C) Taxonomy composition barplots, comparing treatment and age groups at day 30. (D) Heatmap of differentially abundant ASVs between treatment groups at day 30. (E) Principal component analysis (PCA) showing metabolomic ordination by age group and treatment at day 30. (F) Heatmap of differentially abundant metabolites between treatment groups at day 30. (G) Venn diagrams showing unique hits to the antibiotic groups. Top: ASVs. Bottom: Metabolites. (H) Boxplots of differentially abundant ASVs (left) and metabolites (right) unique to the antibiotic RmTBI group at day 30, compared with trends in the Sham group. Boxplots are indicative of median, interquartile range (IQR) (boxes) and 1.5x IQR (whiskers). n.s., not significant.

